
Trading position (short-term; our opinion): No positions are justified from the risk/reward perspective.
On Thursday, crude oil gained 4.56% as a weaker greenback supported the price. In this way, light crude climbed above $50 once again, but did this increase change anything?
Yesterday, the U.S. Department of Labor reported that the initial jobless claims in the week ending January 31 increased by 11,000 to 278,000, from the previous week’s revised total of 267,000. Additionally, a separate report showed that the U.S. trade deficit widened to $46.56 billion in December from $39.75 billion in November, also missing analysts’ forecast. In response to these numbers, the U.D. dollar moved sharply lower, making crude oil more attractive for buyers holding other currencies. As a result, crude oil climbed to an intradya high of $52.10. Will oil bulls be strong enough to hold the commodity above $50 in the coming day(s)?(charts courtesy of http://stockcharts.com).
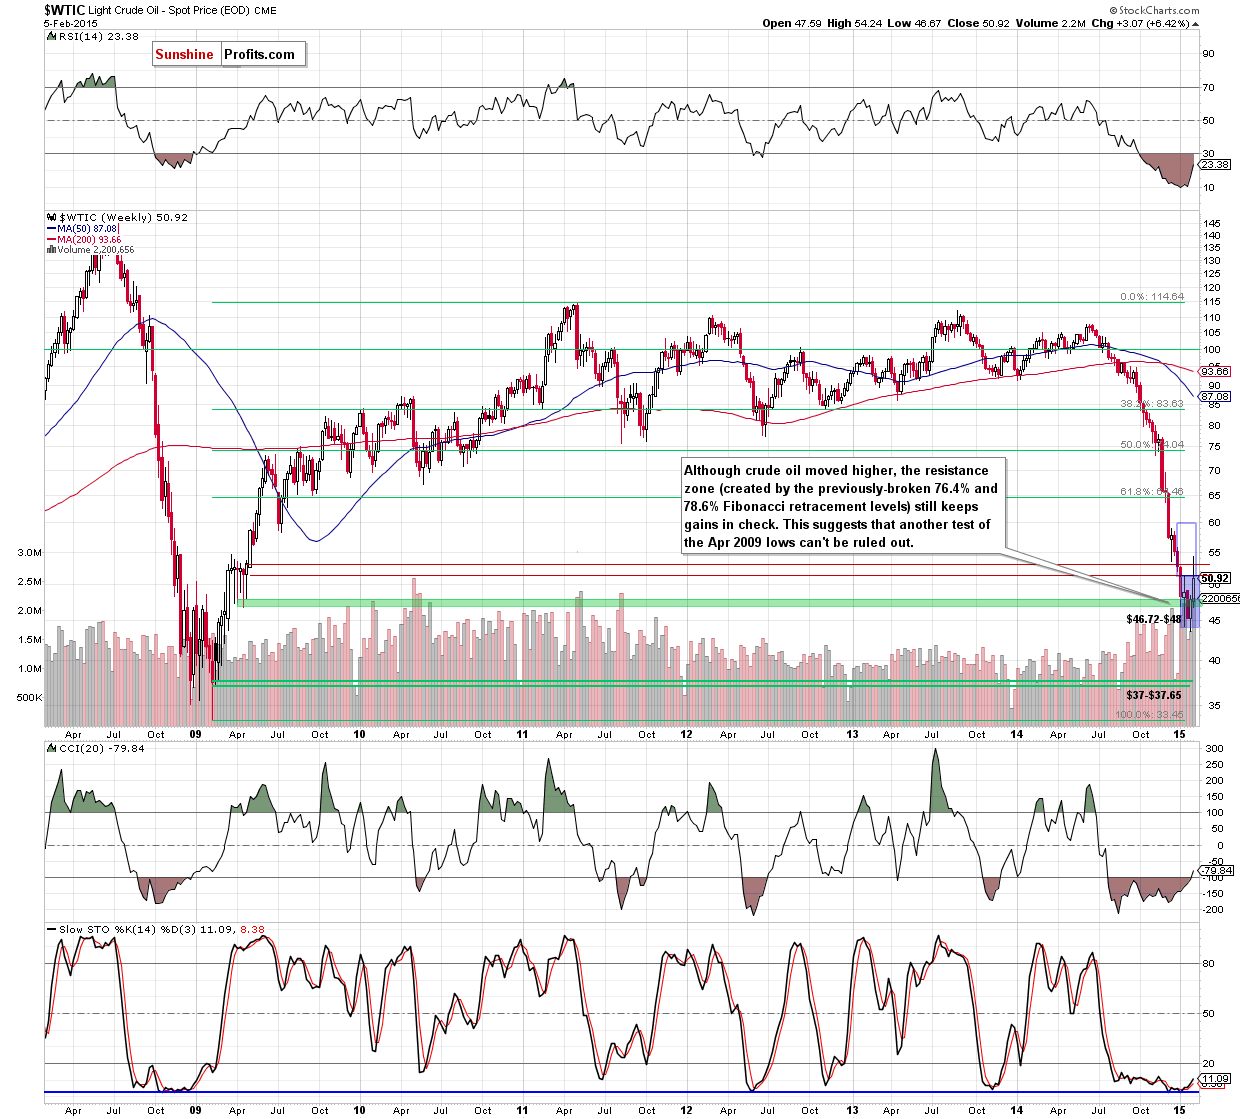
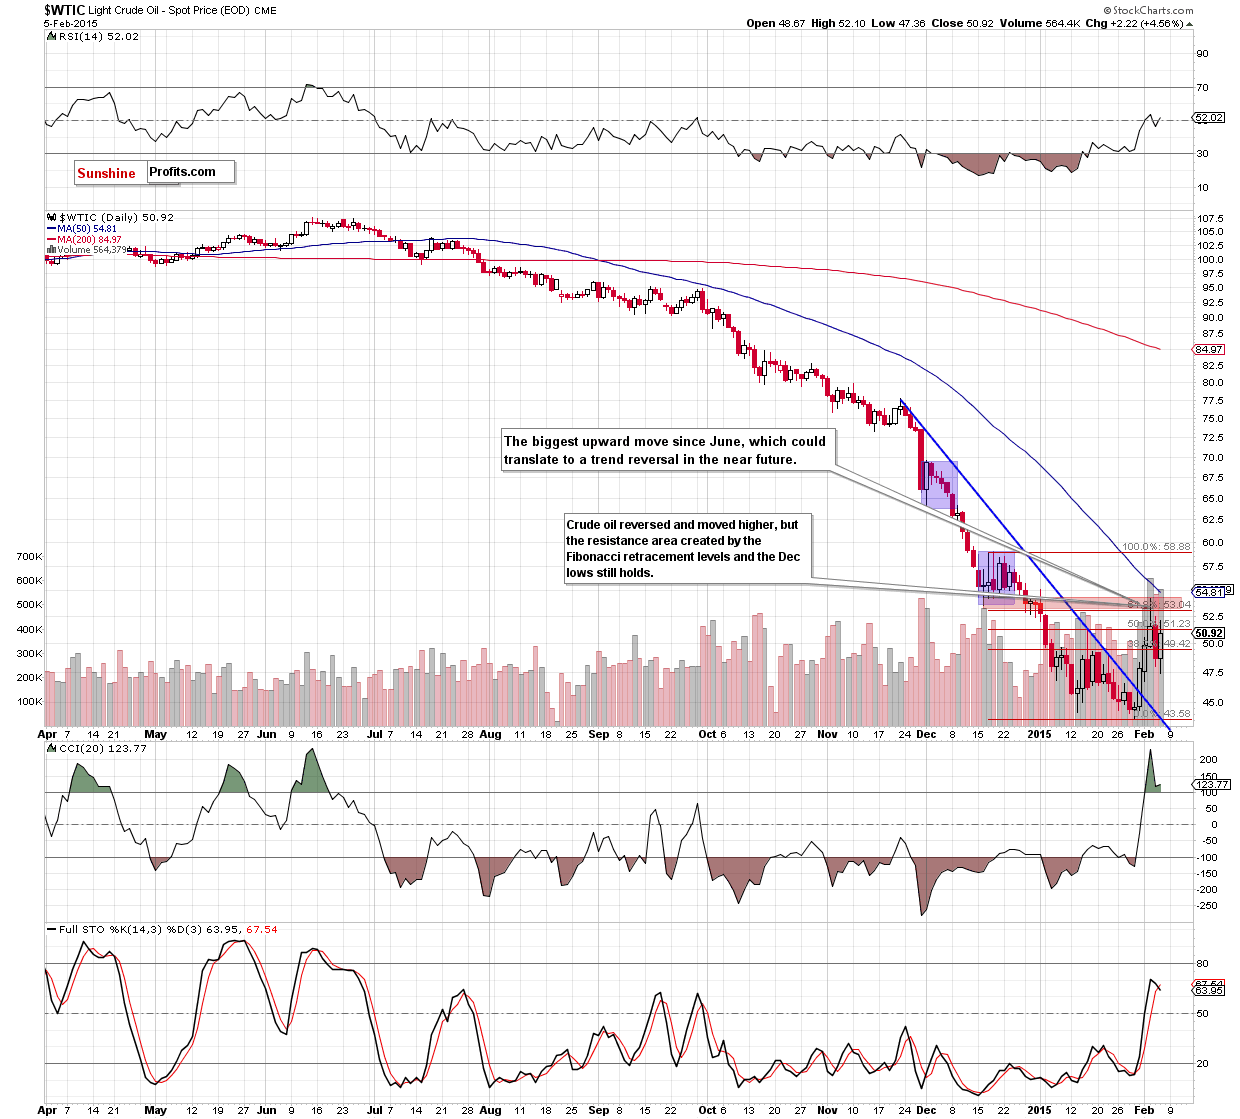
Looking at the above charts, we see that although crude oil reversed and rebound, erasing most of the Wednesday’s decline, the commodity is still trading below the resistance zone created by the 76.4% and 78.6% Fibonacci retracement levels (marked on the weekly chart), the 61.8% retracement (based on the Dec-Jan decline and seen on the daily chart) and the Dec lows. In our opinion, as long as this area is in play, further rally is questionable. Please note that the current position of the CCI and Stochastic Oscillator suggests that another pullback should not surprise us. If this is the case, the initial downside target would be yesterday’s low of $47.36 or even the 70.7% Fibonacci retracement (based on the recent upward move) and the Apr 2009 lows (around $46.70,).
Summing up, although crude oil reversed and rebounded, the commodity is still trading below the 76.4% and 78.6% Fibonacci retracement levels (marked on the weekly chart), the 61.8% retracement (based on the Dec-Jan decline and seen on the daily chart) and the Dec lows. In our opinion, as long as this key resistance zone is in play, further rally is questionable. Taking the above into account, we think that opening any positions is too risky at the moment.
Very short-term outlook: mixed
Short-term outlook: mixed
MT outlook: mixed
LT outlook: bullish
Trading position (short-term; our opinion): No positions are justified from the risk/reward perspective. Nevertheless, if we see a daily close above the 61.8% Fibonacci retracement based on the Dec-Jan decline, we’ll consider opening long positions. We will keep you informed should anything change.
Thank you.
Nadia Simmons
Forex & Oil Trading Strategist
Przemyslaw Radomski, CFA
Founder, Editor-in-chief
Gold & Silver Trading Alerts
Forex Trading Alerts
Oil Investment Updates
Oil Trading Alerts

