
Trading position (short-term): In our opinion no positions are justified from the risk/reward perspective.
On Friday, crude oil erased Thursday’s gains as tepid economic growth in Europe and emerging markets fueled concerns over oil demand. Despite this drop, light crude climbed 0.58% during the last week (it was the third consecutive weekly gain) and remains above $97 per barrel.
The European Union's statistics agency said on Friday that consumer prices rose by just 0.7% in the 12 months to January (down from an 0.8% annual rate of inflation in December), signaling a return to record-low inflation. The drop in the inflation rate fueled fears that low inflation will hinder the currency area's recovery from its long debt and banking crises, and increases the risk that it may slide into deflation, when prices fall.
Also, a selloff in emerging markets that began last week continued on Friday, fueling concerns over future oil demand prospects and weighting on the commodity.
Having discussed the above, let’s move on to the technical changes in the crude oil market (charts courtesy of http://stockcharts.com.)

In our last Oil Trading Alert, we wrote:
(…) light crude (…) reached the 76.4% Fibonacci retracement level based on the recent decline (…) this resistance level (in combination with the proximity to the 200-day moving average) encouraged oil bears to trigger a small pullback (…) light crude reached the 50-week moving average, which successfully paused further growth in early December. If history repeats itself once again, we may see similar price action in the coming week.
Looking at the above chart, we see that crude oil extended its decline and erased Thursday’s increase. With this downswing, light crude slipped below the previous high, which is not a positive signal – especially when we take into account the fact that Friday’s drop materialized on relatively large volume. On top of that, the CCI and Stochastic Oscillator are overbought and close to generating sell signals. Connecting the dots, it seems that a bigger pullback is just around the corner.
Having discussed the current situation in light crude, let’s take a look at WTI Crude Oil (the CFD).
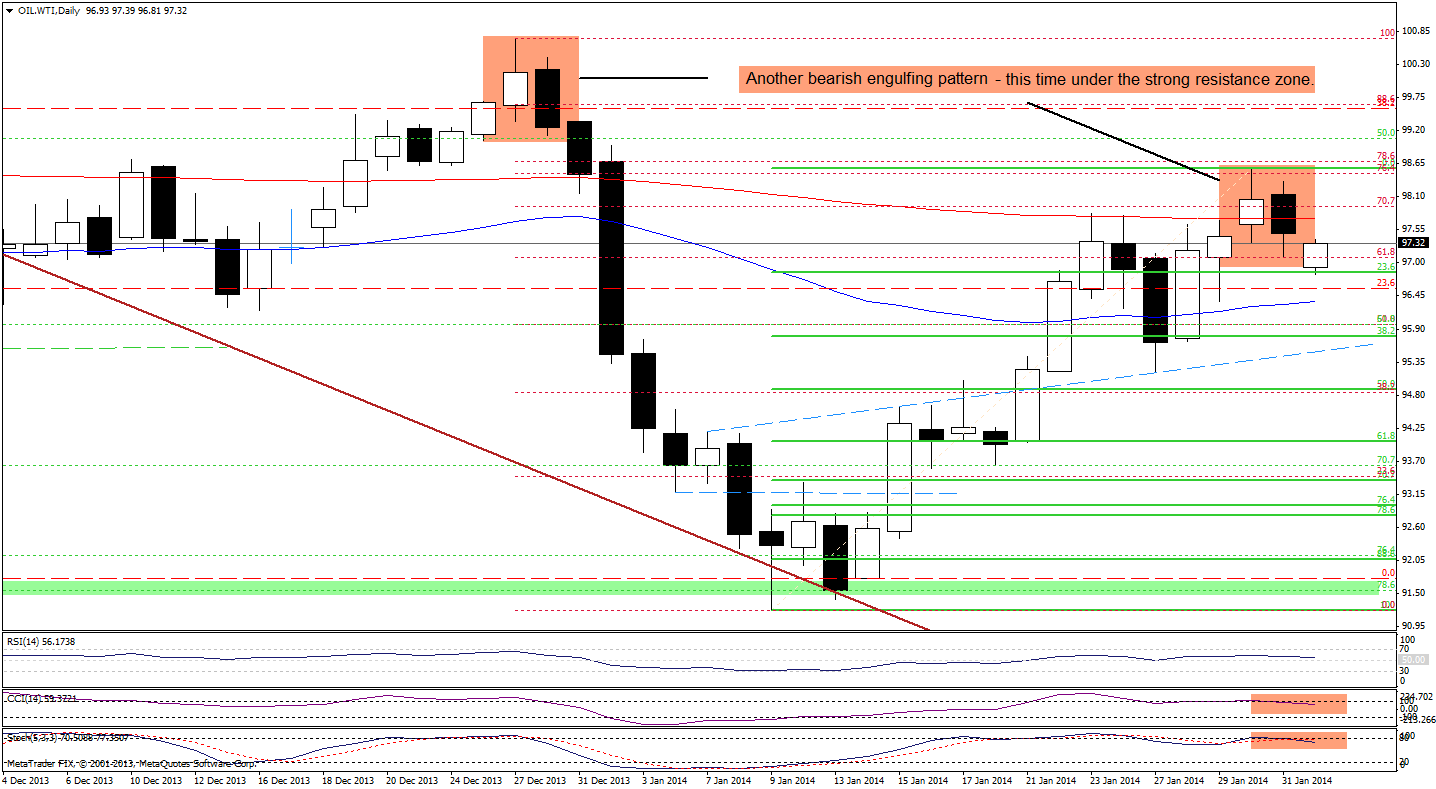
On the above chart, we see that the strong resistance zone (created by the 76.4%, 78.6% Fibonacci retracements and the 150% projection) encouraged sellers to push the price lower on Friday. With this downward move, the CFD not only broke below the 200-day moving average (which was a negative sign), but also closed the day below Thursday’s opening price and formed a bearish engulfing pattern. As you see on the above chart, such candlestick formation triggered a strong sell off at the end of December. From this perspective, it seems that if oil bulls do not manage to invalidate this bearish pattern, we may see similar price action in the coming days.
Looking at the daily chart, we see that earlier today, WTI Crude Oil extended its decline and reached the 23.6% Fibonacci retracement level based on the recent rally. Although this support level, encouraged buyers to act, the CFD still remains below the 200-day moving average, which serves as resistance. The current correction is shallow at the moment, but the CCI and Stochastic Oscillator generated sell signals, which is another bearish sign (we saw similar situation in previous months and back then it had a negative impact on the price). Please note that the nearest support is the 50-day moving average (currently around $96.37), which corresponds to the Jan.29 low.
Summing up, the situation has deteriorated slightly as crude oil declined from a 4-week high. Although, this was not a big drop, light crude slipped below the previous high on relatively large volume, which is not a positive signal - especially when we take into account the position of the indicators and the current situation in the CFD (which declined broke below 200-day moving average and formed a bearish engulfing pattern). Connecting the dots, we can conclude that a bigger pullback is just around the corner.
Very short-term outlook: mixed
Short-term outlook: bullish
MT outlook: bullish
LT outlook: mixed
Trading position (short-term): In our opinion, there were no significant changes in crude oil that justify opening short or long positions at the moment. We will keep you informed should anything change, or should we see a confirmation/invalidation of the above.
Thank you.
Nadia Simmons
Forex & Oil Trading Strategist
Forex Trading Alerts
Oil Investment Updates
Oil Trading Alerts

