
On Friday, crude oil continued its rally and rose to a fresh five-week high as upbeat U.S. economic data boosted the price. In this way, light crude gained 5.43% last week and closed slightly below $98 per barrel.
On Friday, the Department of Labor reported that the U.S. economy added 203,000 jobs in November, beating expectations for a 180,000 increase and up from a downwardly revised 200,000 rise the previous month. Additionally, in the private sector, 196,000 jobs were added last month, compared to expectations for a 180,000 rise, after an increase of 214,000 in October. The report also said the U.S. unemployment rate fell to 7.0% in November from 7.3% in October, beating expectations for a downtick to 7.2%.
Also on Friday, the preliminary Thomson Reuters/University of Michigan consumer sentiment index increased to 82.5 in December from 75.1 the previous month, far surpassing expectations for a 76.0 reading.
The above numbers showed that the US is making decent progress on the employment front and demonstrating that the US economy is recovering better than expected. On the one hand, they pushed the price of light crude higher on sentiments that the U.S. economy is gaining steam and will demand more fuel and energy going forward. On the other hand, the monetary implications of such improving data fueled expectations that the Federal Reserve will begin scaling back its $85 billion in monthly bond purchases in 2014, which capped further gains.
Having discussed the above, let’s move on to the technical changes in the crude oil market (charts courtesy of http://stockcharts.com).
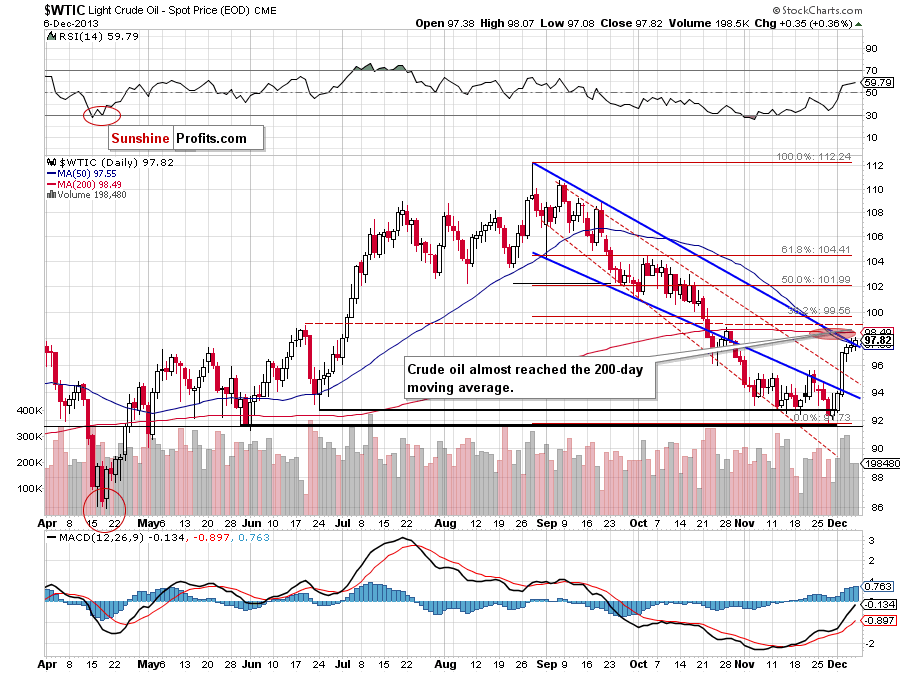
Looking at the above chart, we see that crude oil extended gains during Friday’s session and successfully broke above the upper border of the declining trend channel and the 50-day moving average. In this way, light crude almost reached the 200-day moving average, which stopped growth at the end of October. On top of that, Friday’s breakout materialized on lower volume (compared with previous days). Taking the above facts into account, we can conclude that a pause after the recent rally should not surprise us.
However, if this resistance level is broken, the first target for oil bulls will be the 38.2% Fibonacci retracement level around $99.55. The nearest support is the previously-broken upper line of the declining trend channel in terms of daily closing prices.
Having discussed the current situation in crude oil, let’s take a look at WTI Crude Oil.
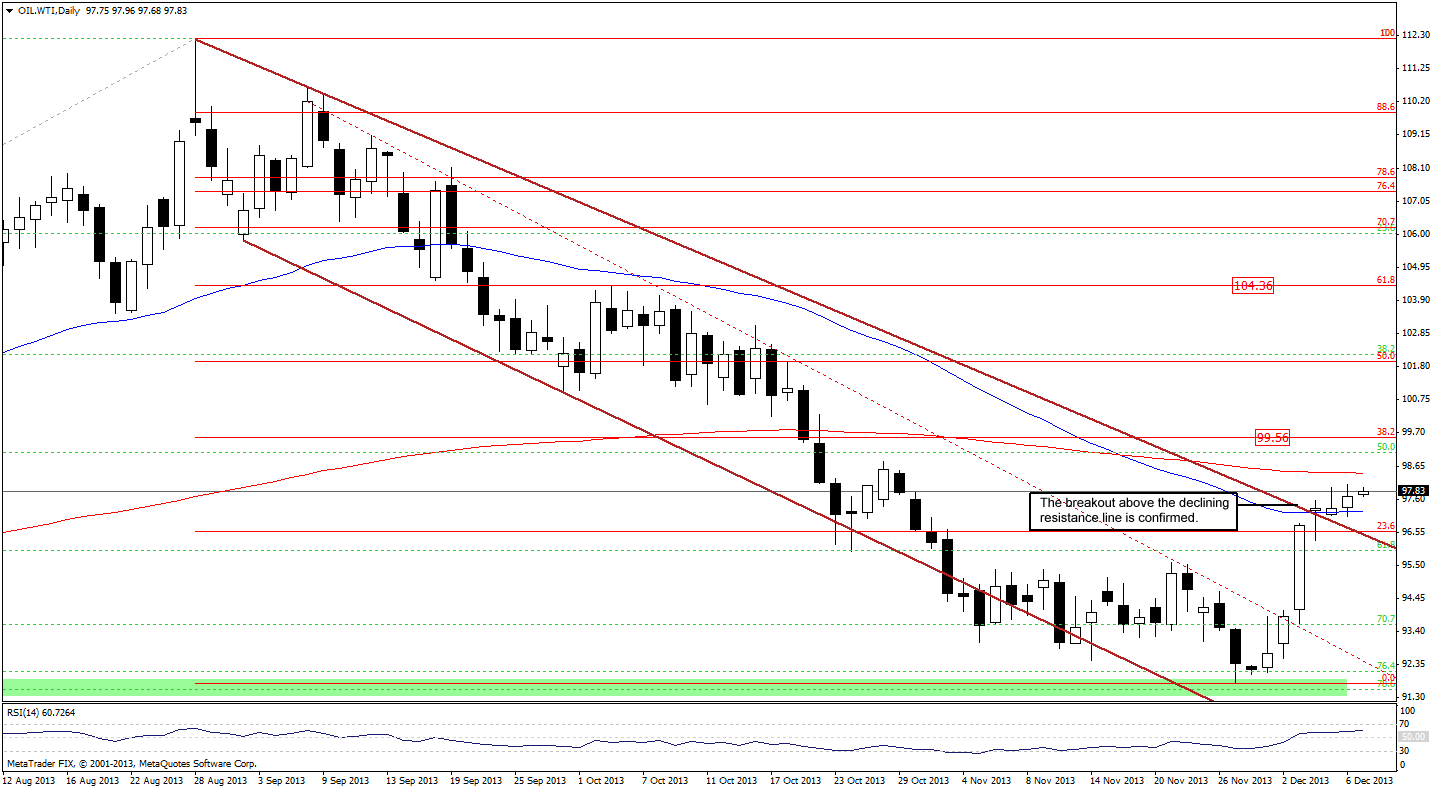
As you can see on the above chart, the breakout above the upper line of the declining trend channel was confirmed, which is a strong bullish signal. Although, the price remains in a narrow range, it seems that the current consolidation may be just a pause before further increases.
The nearest support is created by the previously-broken upper line of the declining trend channel and reinforced by the 23.6% Fibonacci retracement level. The first upside target is the 38.2% Fibonacci retracement level around $99.55.
Once we know the above, let’s take a look at the NYSE Arca Oil Index (XOI) weekly chart.
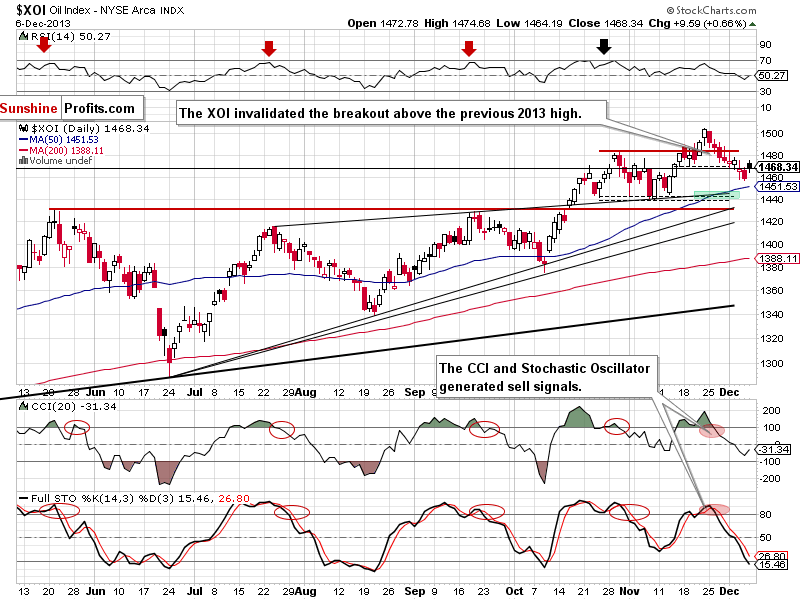
On the above chart, we see that the oil stock index rebound slightly after Thursday decline and gained 0.66%. In this way, the XOI came back above the upper line of the rising wedge (currently around 1,465), which is a bullish sign.
However, Friday upswing didn’t change much from the short-term perspective because the XOI still remains below the previous 2013 high. Additionally, sell signals generated by the indicators remain in place and encourage sellers to act.
At this point, it’s worth noting that recent days have formed a consolidation on the above chart. If the XOI moves above 1,475, we may see further improvement and an attempt to move above 1,483 (the previous 2013 top). On the other hand, if oil stocks drop below 1,457, we will likely see further deterioration. In this case, the first downside target will be the 50-day moving average (currently at 1,450). If it’s broken, we may see a downward move to a support zone created by the upper line of the rising wedge (marked with the thin black line) and the bottom of the correction that we saw at the beginning of November (around 1,440-1,446).
Summing up, crude oil increased once again and broke above its first resistance zone. On Friday, light crude almost reached the 200-day moving average, which stopped buyers at the end of October. Therefore, a short-term pullback seems likely, however, based on the size of last week's rally and the accompanying volume, it seems that it will be just a pause / pullback, not another big move lower.
Very short-term outlook: bullish
Short-term outlook: bullish
MT outlook: mixed with bullish bias
LT outlook: mixed
Trading position (short-term): Long. Stop-loss order for this position: $91.55. Stop-loss order for the WTI Crude Oil: $91.30. We will keep you informed should anything change, or should we see a confirmation/invalidation of the above.
Thank you.
Nadia Simmons
Sunshine Profits' Crude Oil Expert
Oil Investment Updates
Oil Trading Alerts

