
On Wednesday, investors received a bullish US Energy Information Administration oil data, which showed that US commercial crude stocks fell 4.37 million barrels to 355.63 million barrels for the reporting week ended September 13. Inventories hit its lowest level since March 2012.
These numbers encouraged buyers to act and resulted in an increase after several sessions of declines fueled by a faded possibility of a U.S. military attack on Syria. In this way, the price of crude oil erased some earlier losses and came back to over $106 per barrel. As it turned out later, it was not the end of good news for oil bulls.
Another factor, which had a great impact on today's prices, was the FOMC statement, which followed earlier bullish EIA data. Most economists expected that the U.S. central bank will announce a $10 billion or even $20 billion reduction. Meanwhile, investors heard two words: no taper. The central bank assured that there would be no changes to its monetary stimulus program.
What impact did these events have on crude oil’s chart?
After these words, the price of light crude increased sharply to over $108 per barrel and closed above the previously-broken 50-day moving average. It’s a very bullish sign, because in this way, the breakdown below this moving average was invalidated and buyers didn’t lose their major ally. Additionally, the price of light crude rebounded sharply from the rising support line based on the August lows. It’s worth noting that this support line stopped oil bears on September 3 and it did it once again during today’s session, which is another bullish signal.
At this point, it’s also worth mentioning that the recent three days have formed a bullish morning star candlestick pattern, which supports a strong support zone based on the 50-day moving average and the above mentioned rising support line at the moment.
When we take a look at the daily chart we also see a triangle (marked with blue).
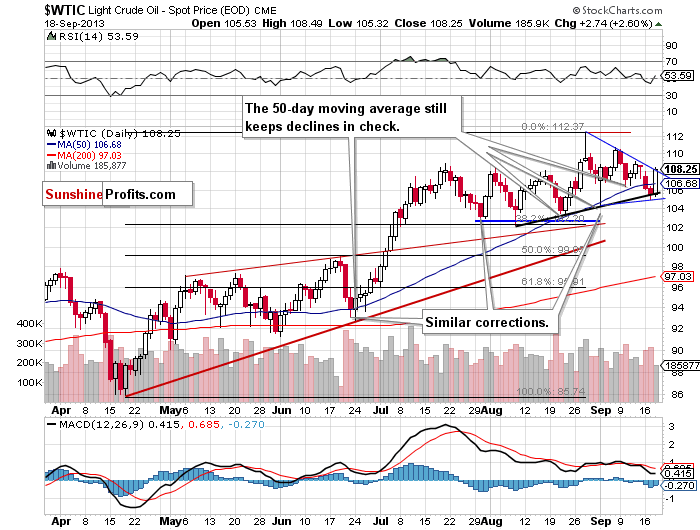
If the oil bulls do not give up and the price of light crude increases above the upper line of the triangle, we will likely see further growths in coming days. In this case, the price target for the pattern will be above $115 per barrel. However, it is important to watch how crude oil reacts to resistance levels at: $110.70 and $112.24.
To summarize: Although crude oil lost almost $6 since the September 6, the entire recent decline was smaller than the downward move from the August 28 top to the September 3 low (in that time light crude lost slightly above $8). Additionally, the August-September decline is still similar to the previous ones: from the July 19 top to the August 8 low and from the June 19 top to the June 24 low. From this perspective the uptrend is not threatened.
From today’s point of view it seems that crude oil will likely remain higher because of the popular/prevailing/public sentiment that the Fed will merely begin to wind down its bond-buying program but won't end it, which should continue to support prices for the foreseeable future.
Long-term outlook: bullish.
Medium-term outlook: somewhat mixed, but with a bullish bias.
Short-term outlook: still bullish. As long as all corrective moves since June are similar, the uptrend is not threatened.
Trading position (short-term): If crude oil climbs above the September 12 top and the breakout will be confirmed we suggest opening long positions. We will keep you informed should anything change, or should we see a confirmation/invalidation of the above.
Thank you,
Nadia Simmons

