

Trading position (short-term; our opinion): No positions are justified from the risk/reward perspective.
Wednesday’s breakout brought a fresh 2018 peak, but crude oil didn’t extended gains during yesterday’s session. Is this a sign of weakness or just the calm before the storm?
Technical Analysis of Crude Oil
Let's examine the charts below (charts courtesy of http://stockcharts.com).
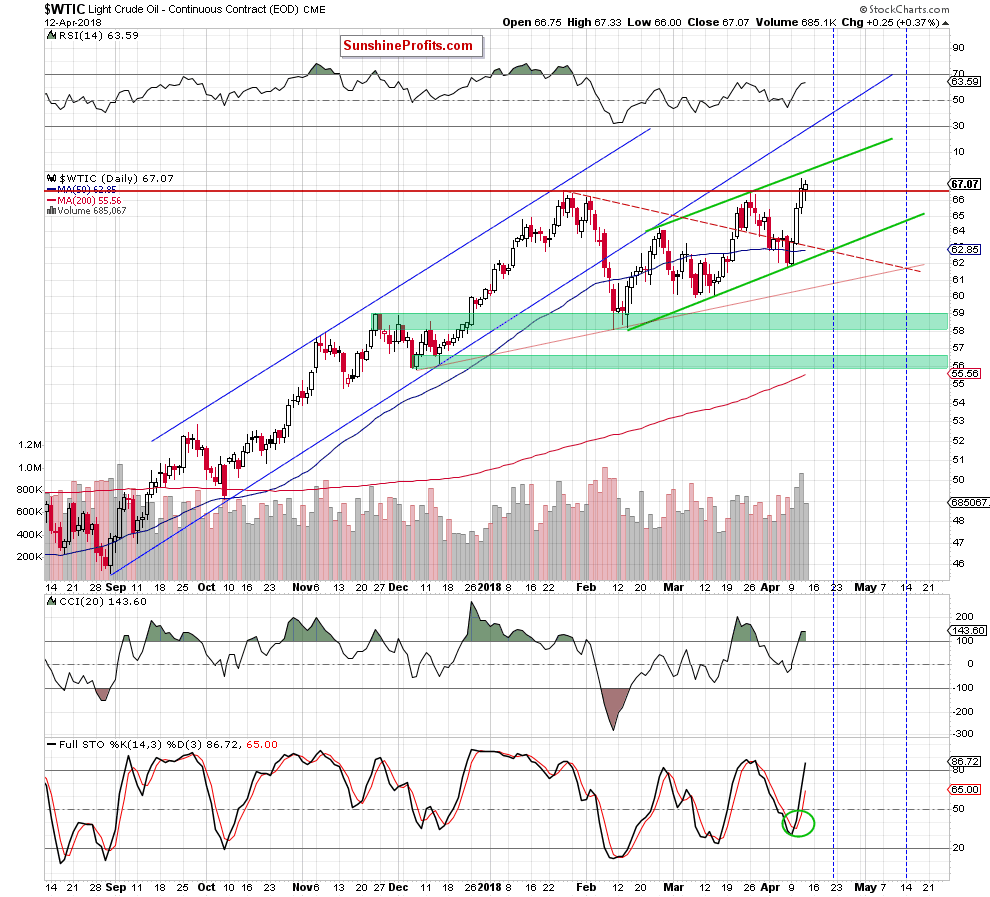
Looking at the daily chart, we see that although crude oil moved a bit lower after yesterday’s market’s open, oil bulls stopped their opponents quite quickly, which resulted in a comeback above the previously-broken January peak.
In this way, the commodity invalidated the earlier breakdown under the red horizontal line based on the early 2018 high, which together with the buy signal generated by the Stochastic Oscillator suggests another attempt to move higher.
Nevertheless, when we take a closer look at the volume, we see that it was much smaller compared to what we saw a day earlier, which raises some worries about the buyers’ strength. Therefore, in our opinion, as long as the commodity remains inside the green channel oil bulls may have some problems with further rally.
At this point, it is also worth noting that even if they manage to push black gold above this first resistance, the space for gains seems limited. Why? We believe that the best answer to this question will be the quote from our last Oil Trading Alert:
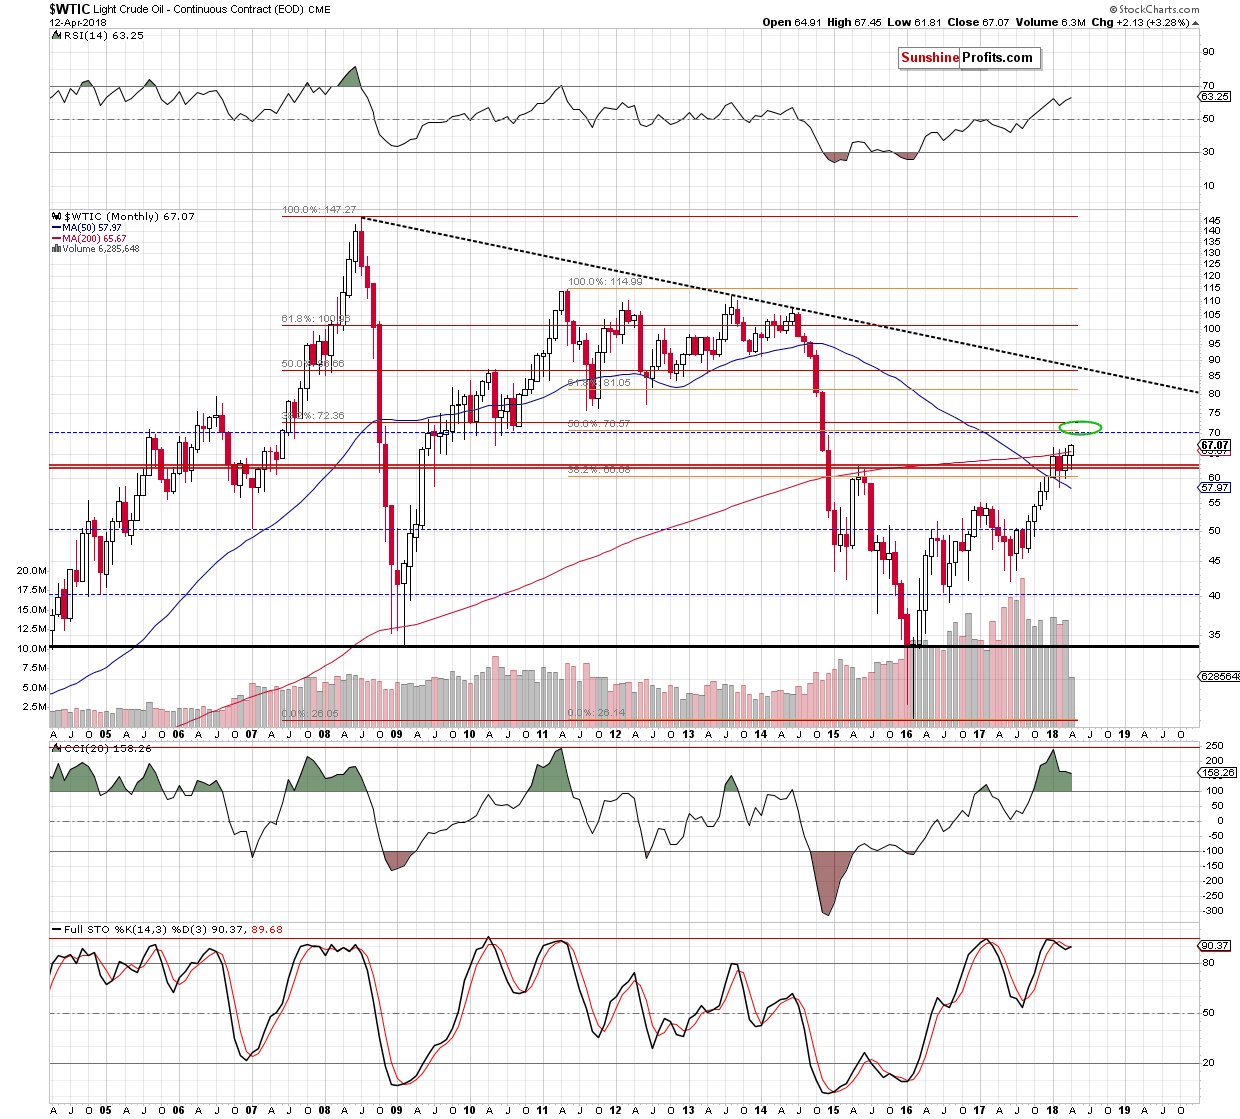
(…) How high could light crude go? From this perspective, we see that the nearest resistance zone is not far from yesterday’s closing price (around $70-$72.36) and is created by 3 important levels: the 38.2% Fibonacci retracement based on the entire 2008-2016 downward move, the 50% retracement based on the 2011-2016 downward move and the barrier of $70.
This means that even if the price of black gold breaks through yesterday's peak, the pro-growth potential is not too big at this moment - especially when we factor in (…) Elliott waves theory. What do we mean by that? Let’s take a look at the chart below.
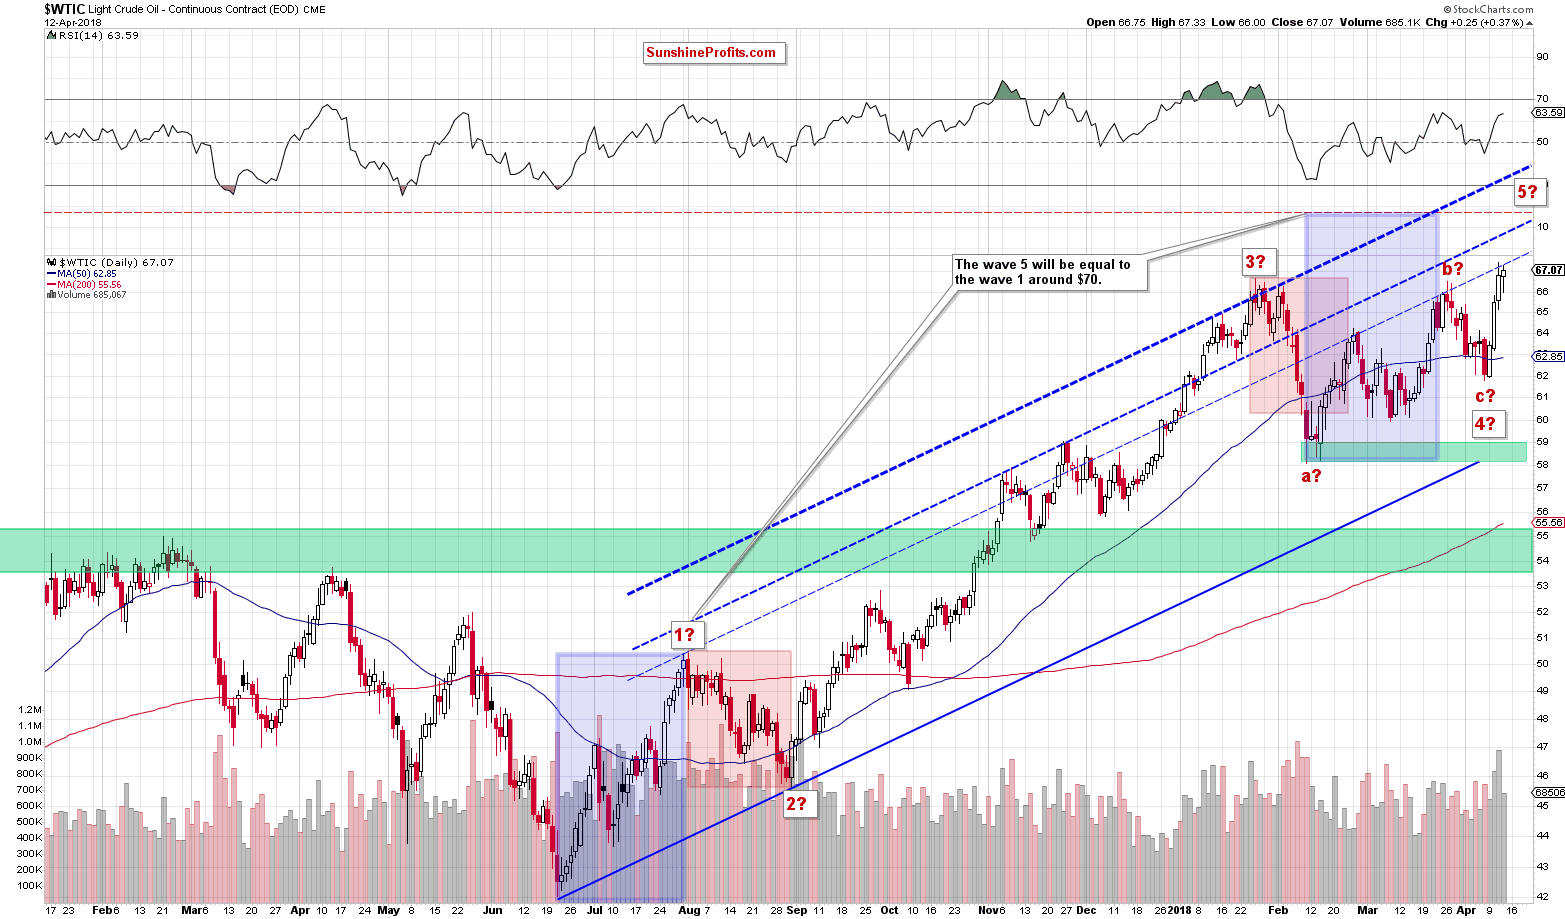
As you see on the above chart, a potential wave 5 will be equal to the wave 1 around $70, which increases the probability of reversal in this area (in other words, oil bears have one more reason to act in around the next strong resistance zone about which we wrote earlier). Therefore, we decided to wait at the sidelines for more bullish/bearish signals before we open next positions.
We’ll keep you - our subscribers - informed should anything change, or should we see a confirmation/invalidation of the above.
Trading position (short-term; our opinion): No positions are justified from the risk/reward perspective. We will keep you – our subscribers – informed should anything change.
Thank you.
Nadia Simmons
Forex & Oil Trading Strategist
Przemyslaw Radomski, CFA
Founder, Editor-in-chief, Gold & Silver Fund Manager
Gold & Silver Trading Alerts
Forex Trading Alerts
Oil Investment Updates
Oil Trading Alerts

