

Trading position (short-term; our opinion): Short positions (with the stop-loss order at $68.15 and the initial downside target at $56.57) are justified from the risk/reward perspective.
Yesterday, crude oil gained 2.38% after the EIA report showed that crude oil inventories rose less than analysts' forecasts. In our opinion, that reaction was overdone in the light of other data. Why? We invite you to read today's alert.
Yesterday, the Energy Information Administration showed that crude oil inventories rose by 1.8 million barrels, which as we mentioned earlier, was less than analysts' forecasts. Is this a reason for satisfaction? In our opinion, it’s not, because gasoline stocks rose by 3.6 million barrels, more than double the forecast and distillate inventories also increased more than expected.
Looking at yesterday’s price action, it seems that oil investors missed the most important message of the day – the fact that crude oil production climbed to a record 10.27 million barrels per day. In this way, the U.S. become a bigger producer than Saudi Arabia, which increases the probability of further improvement in the number of active oil rigs in the coming weeks. What does it mean for crude oil? In our opinion, lower prices in the coming (at least days), but to have a bit more certainty, let's check what will the technical picture of black (charts courtesy of http://stockcharts.com) tell us about yesterday’s increase and future’s moves of crude oil.
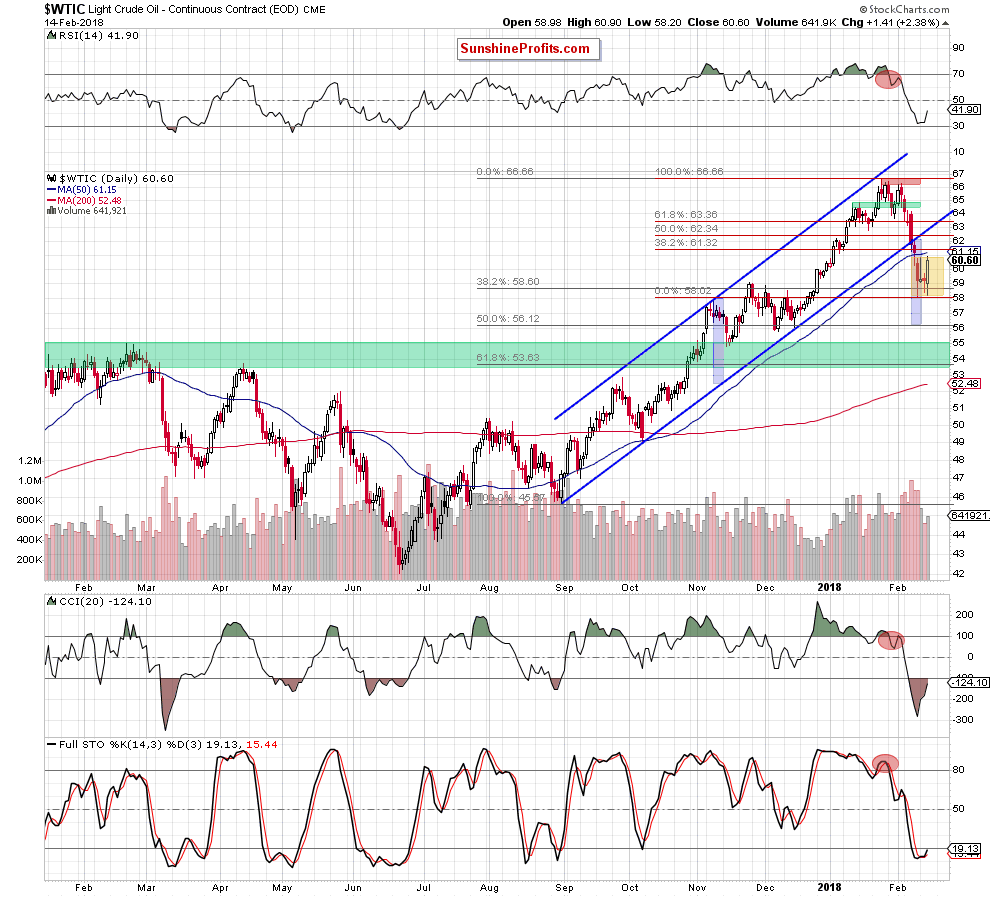
Looking at the very short-term picture of crude oil, we see that the commodity bounced off the 38.2% Fibonacci retracement (based on the August-January upward move) once again, which resulted in a quite sharp move to the north.
Although light crude gained over 2% thanks to this increase, we clearly see that black gold is still trading inside the yellow consolidation between the above-mentioned retracement and the previously-broken 50-day moving average.
What does it mean? In our opinion, some short-lived uncertainty about the direction of the next move. On one hand, the buy signal generated by the Stochastic Oscillator together with the unsuccessful breakdown under the 38.2% retracement could trigger further improvement. On the other hand, despite yesterday’s upswing oil bulls didn’t manage to push the commodity not only to the 38.2% Fibonacci retracement (based on the entire recent downward move – we marked it with red), but light crude didn’t even climb above the upper line of the consolidation.
What stopped oil bulls? In our opinion, the same important factor as earlier this week - the upper border of the green rising trend channel marked on the weekly chart below.
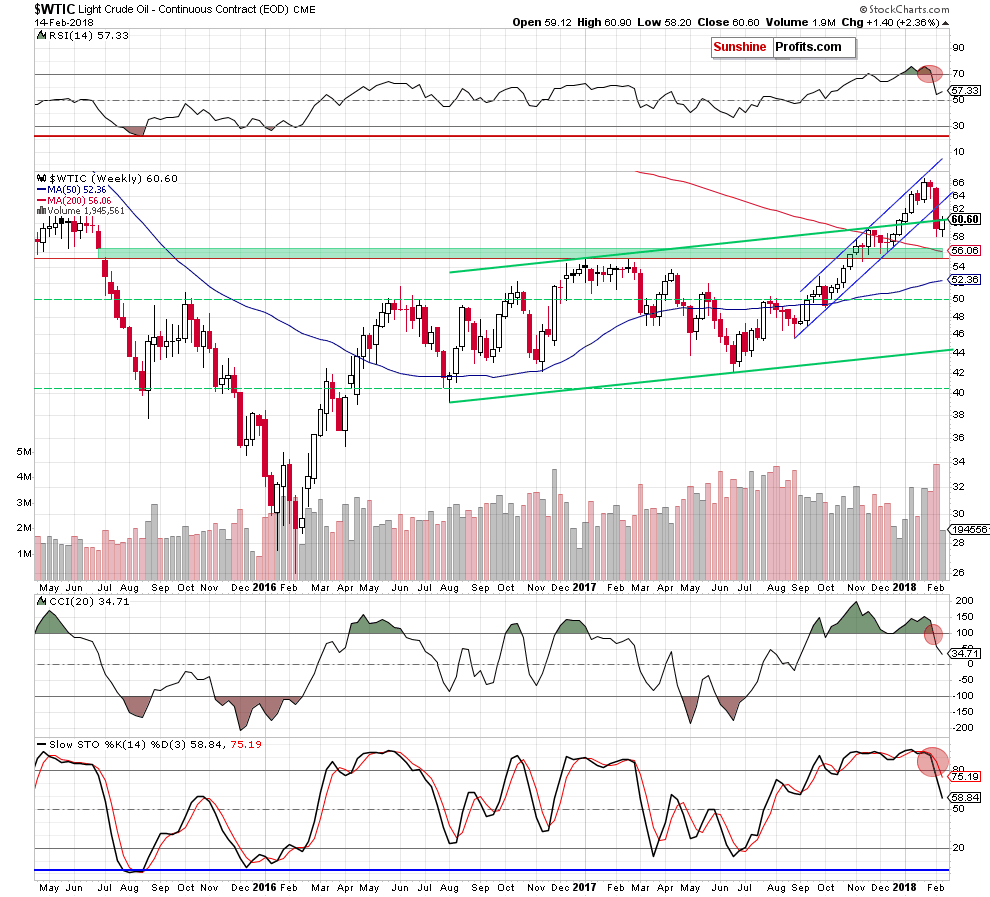
From the medium-term perspective, we see that although crude oil tried to break above it, this strong resistance withstood the buying pressure. This means that the invalidation of the breakout above this line and its potential negative impact on the price are still in effect, supporting oil bears and another attempt to move lower.
This scenario is also reinforced by the sell signals generated by all the medium-term indicators and the long-term picture of light crude. Let’s analyze the monthly chart below.
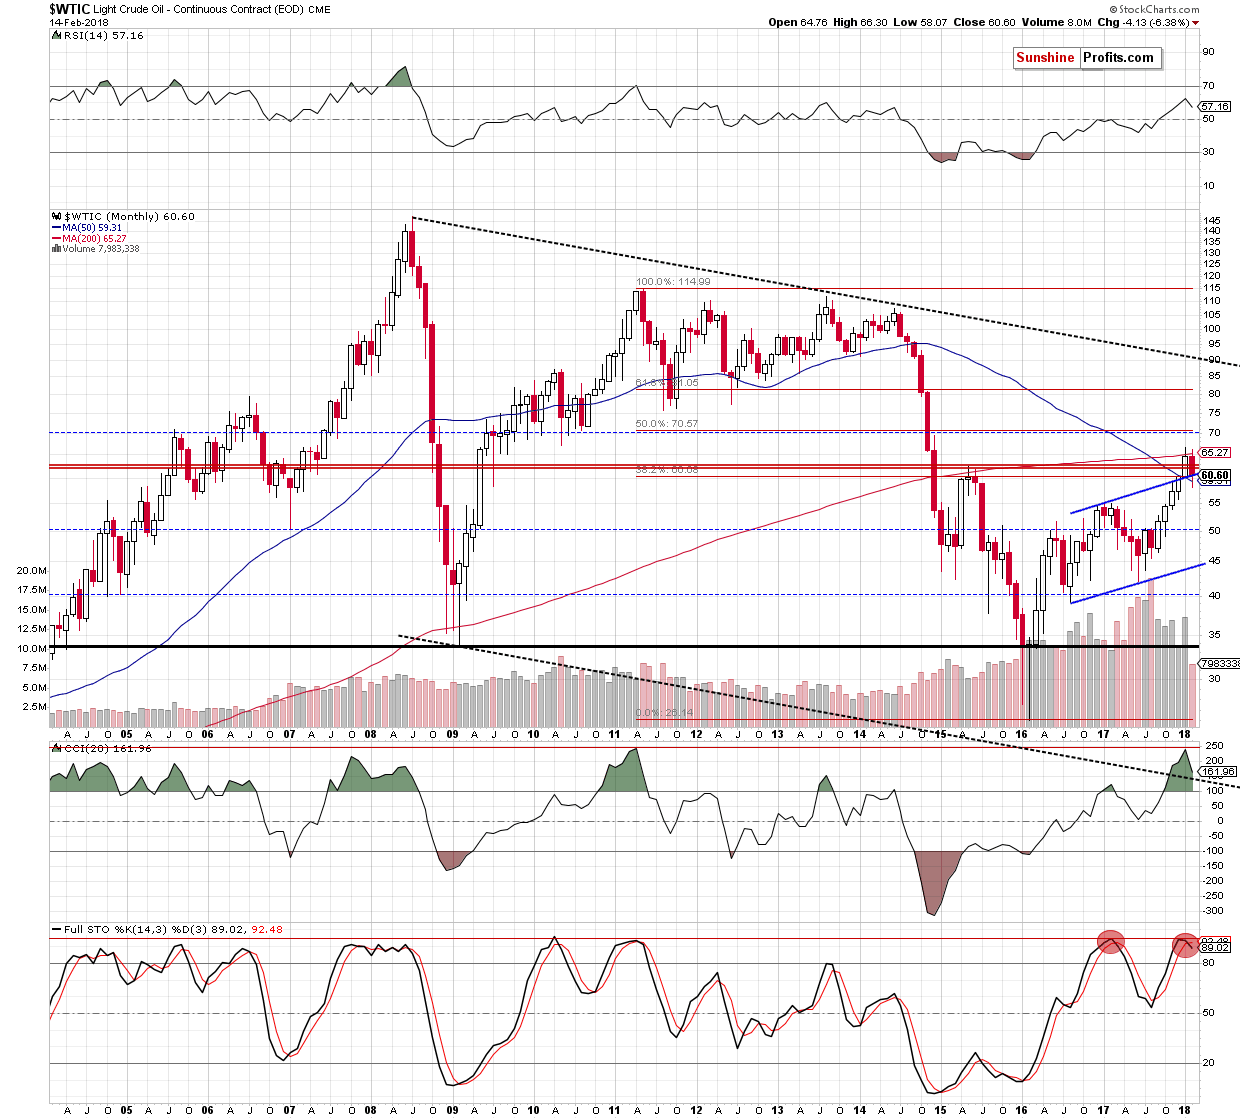
Looking at the above chart, we clearly see that despite yesterday’s upswing all earlier invalidations of the breakouts (above the 200-month moving average, the May 2015 peaks and the 38.2% Fibonacci retracement) also favor oil bears and lower prices of black gold – especially when we factor in the sell signal generated by the Stochastic Oscillator.
Connecting the dots, we continue to believe that short positions continue to be justify from the risk reward perspective and another move to the downside is just around the corner.
Where will crude oil head if the situation develops in line with our assumptions? As we wrote in previous alerts, the first downside target will be around $55.82-$56.12, where the December lows and the 50% Fibonacci retracement are. Additionally, in this area the size of the downward move will correspond to the height of the blue rising trend channel, which increases the probability that oil bears will test this area, making our short positions even more profitable in the coming week.
As always, we’ll keep you - our subscribers - informed should anything change, or should we see a confirmation/invalidation of the above.
Thank you.
Nadia Simmons
Forex & Oil Trading Strategist
Przemyslaw Radomski, CFA
Founder, Editor-in-chief, Gold & Silver Fund Manager
Gold & Silver Trading Alerts
Forex Trading Alerts
Oil Investment Updates
Oil Trading Alerts

