

Trading position (short-term; our opinion): No positions are justified from the risk/reward perspective.
In our last alert, we wrote the following:
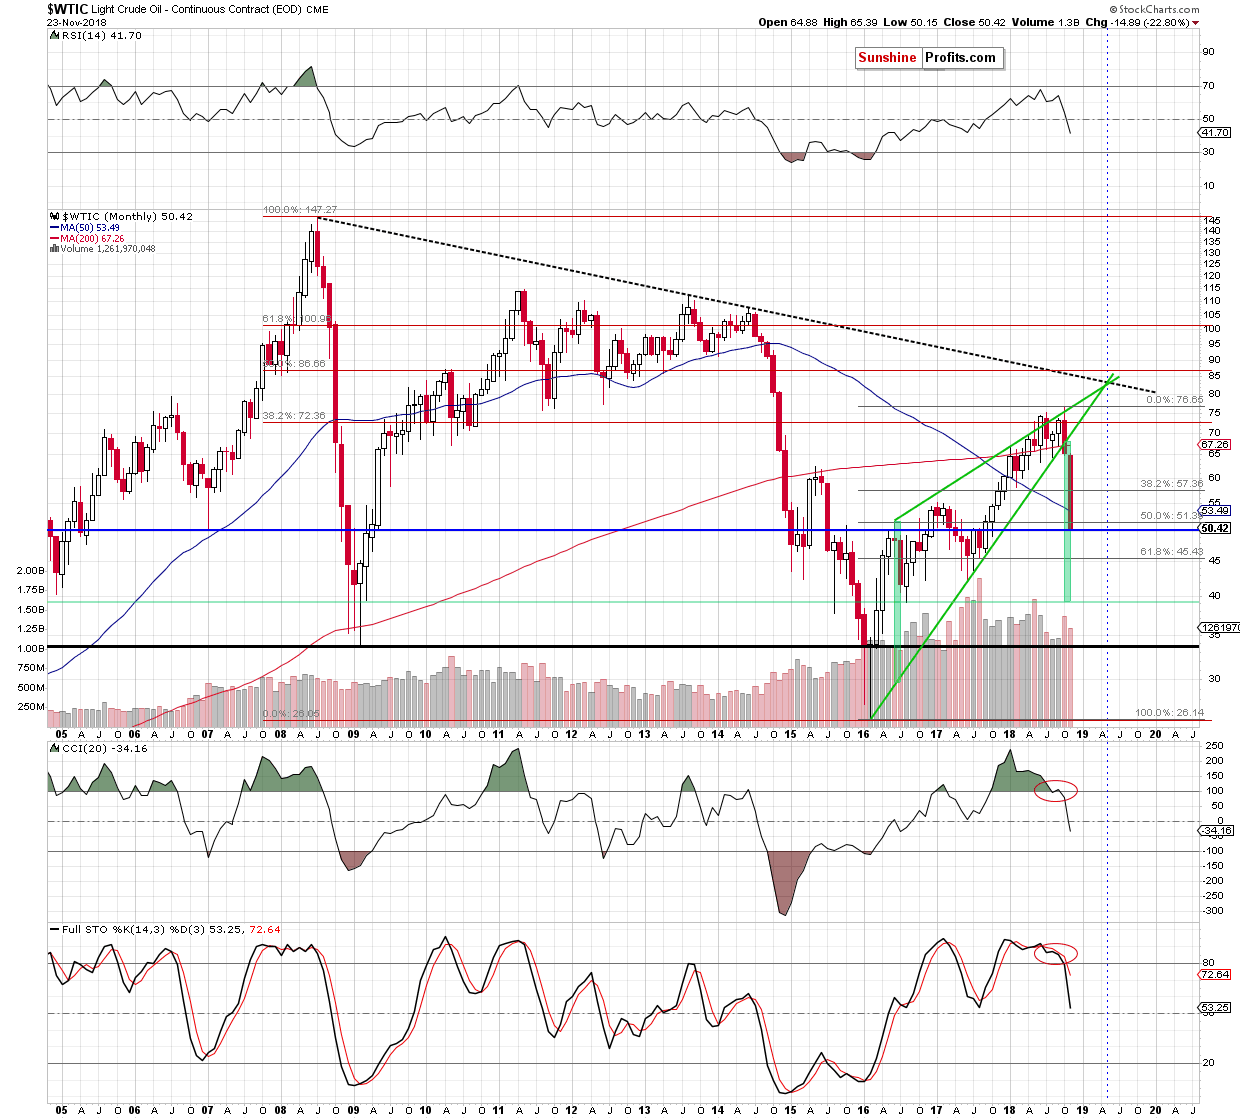
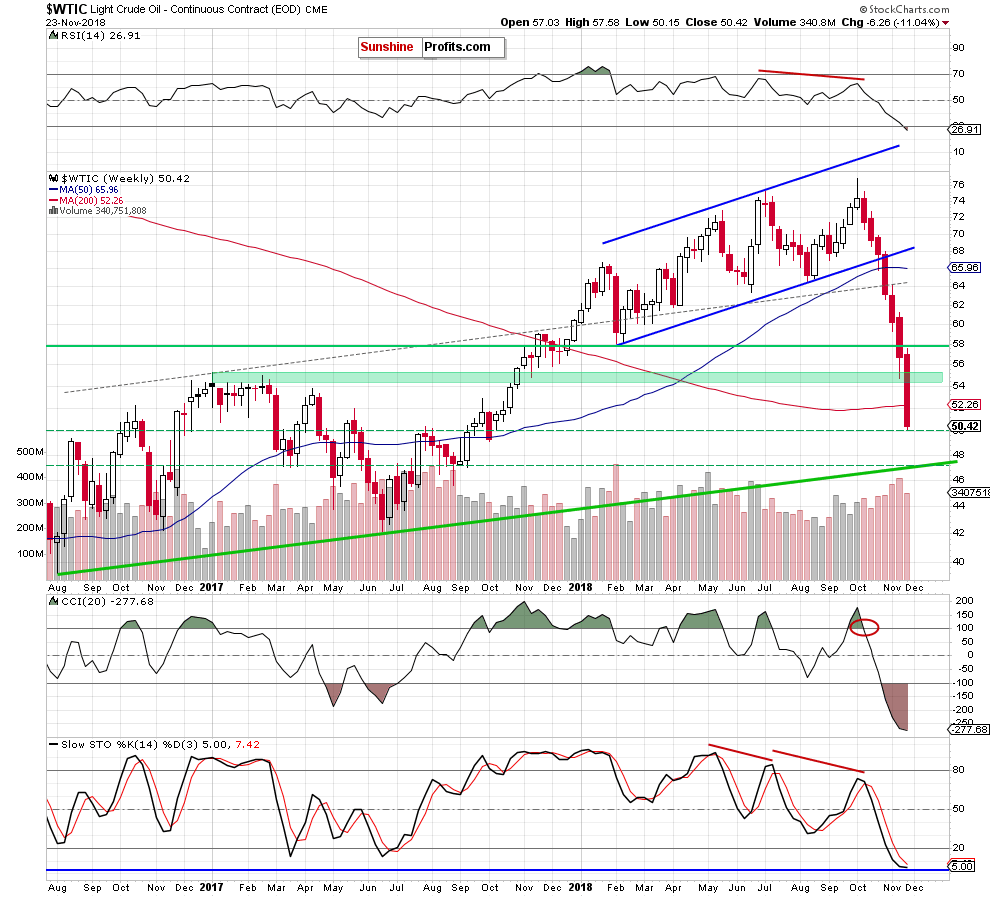
(…) if today’s government data on crude oil and its products disappoint market participants, further deterioration and a test of the 200-week moving average (currently at $52.27) or even the 50% Fibonacci retracement based on the entire 2016-2018 upward move can’t be ruled out.
Looking at the above charts (charts courtesy of http://stockcharts.com), we see that the sellers not only tested the above-mentioned levels, but also managed to close the whole week below them, which is a bearish development.
Thanks to the last week’s decline crude oil approached the barrier of $50, which is the last stop before a test of the level of $47, where the long-term green support line based on the August 2016 and June 2017 lows is.
Earlier today, oil bulls used the barrier of $50 to trigger a rebound, which took the commodity above $51. Is this the first sight of trend reversal? It’s hard to say at the moment of writing these words, because we don’t have the size of today’s volume yet. Nevertheless, if oil bills fail, the way to the above-mentioned long-term green support line will be open. We will keep you informed should anything change, or should we see a confirmation/invalidation of the above.
Trading position (short-term; our opinion): No positions are justified from the risk/reward perspective. We will keep you – our subscribers – informed should anything change.
Thank you.
Nadia Simmons
Forex & Oil Trading Strategist
Przemyslaw Radomski, CFA
Founder, Editor-in-chief, Gold & Silver Fund Manager
Gold & Silver Trading Alerts
Forex Trading Alerts
Oil Investment Updates
Oil Trading Alerts

