

Trading position (short-term; our opinion): Short position in crude oil with a binding profit-take level at 50.03 and stop-loss level at $52.83.
The oil bulls took the center stage last week, and apparently cleared quite a few hurdles in the process. Let's take a balanced look at the recent price action and the trading decision that naturally follows.
We'll start with the daily chart examination (charts courtesy of http://stockcharts.com).
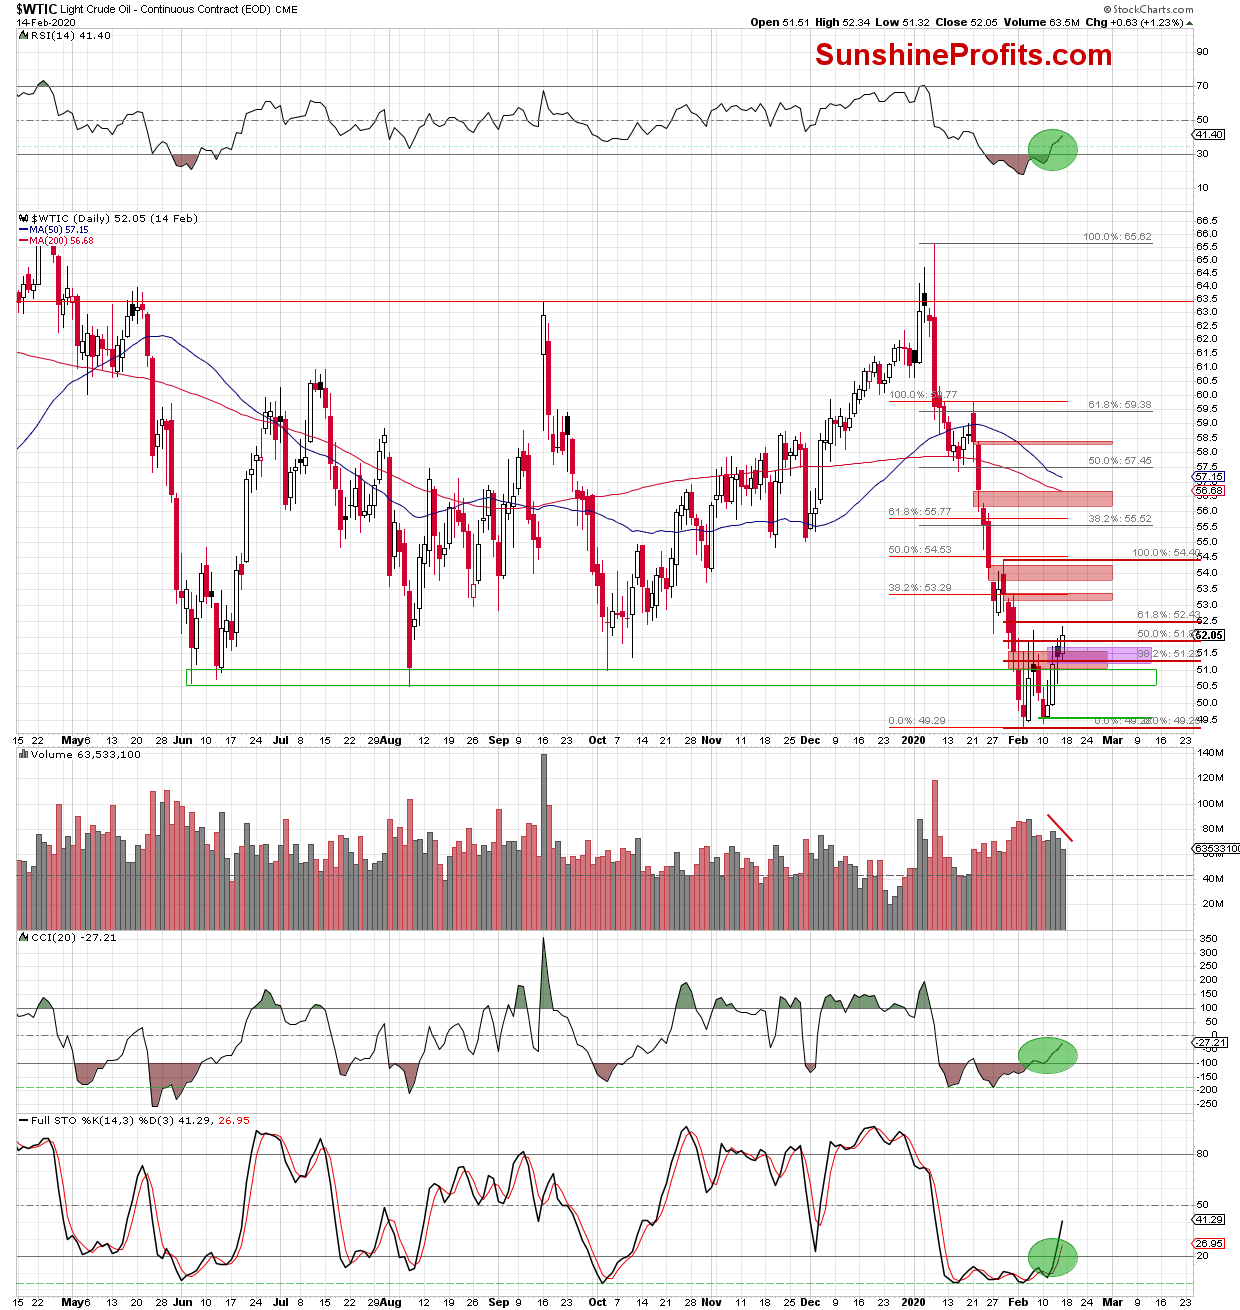
The first thing that catches the eye on the daily chart, is Friday's close above the major short-term resistance - the red gap created at the beginning of the month.
The gap becoming history also had a positive impact on the weekly chart.
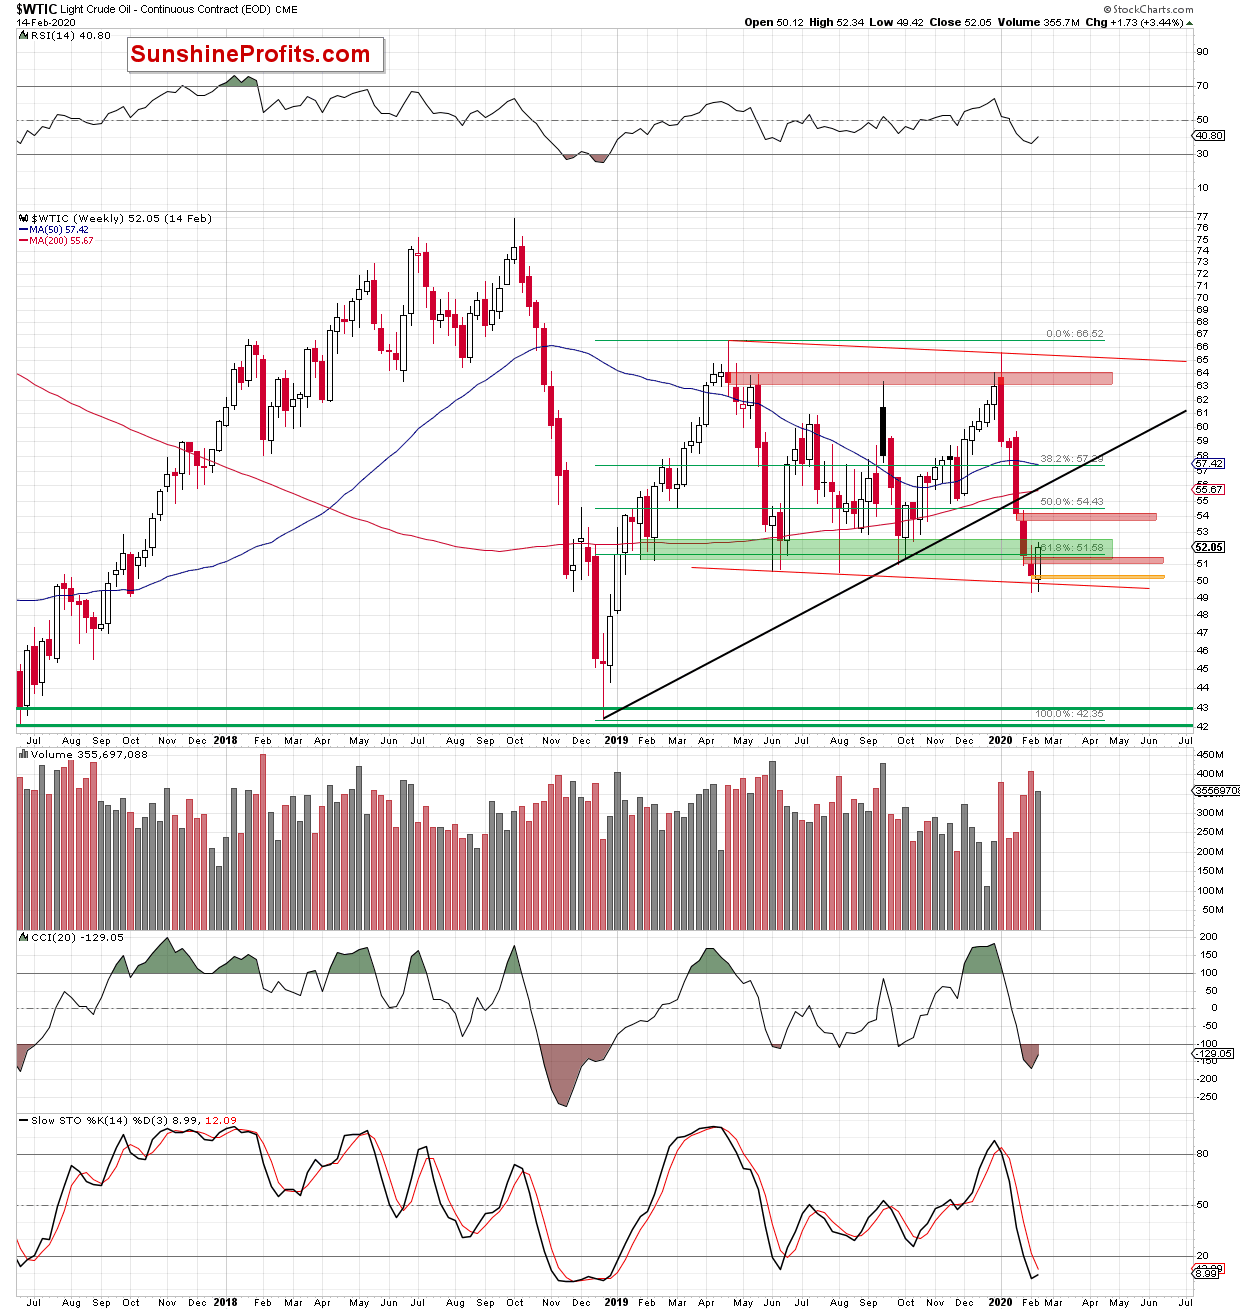
We see that the commodity not only closed the gap, but also finished the week above the previously broken lower border of the declining red trend channel, invalidating its earlier breakdown.
Let's zoom out to see what else the recent upswing brought about. The monthly chart below shows that black gold also cleared above another important resistance.
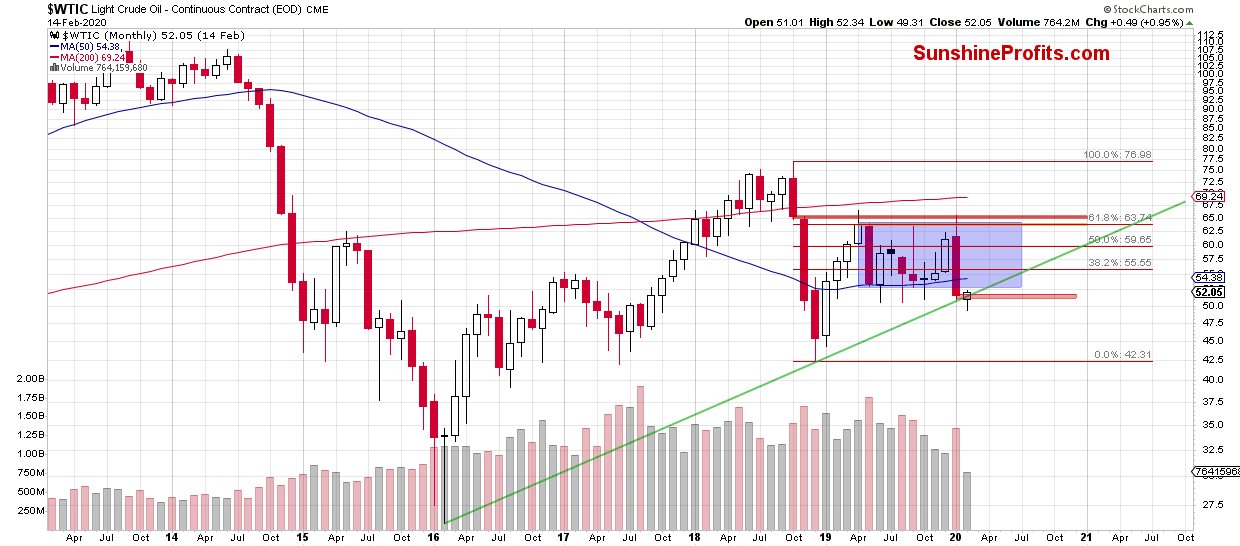
It's the previously broken long-term green resistance line based on the previous lows that crude oil just climbed above.
It might seem that the summary of today's Oil Trading Alert would contain just positive factors that would support the bullish outlook and opening long positions, right?
Taking a second look at all of the above charts reveals that the picture is not as bright for the bulls, however.
Let's go through the points one by one.
First, the daily chart. While the bulls managed to close the gap, they didn't finish the day above the previous February peak. Thus, it continues to serve as a nearest resistance. The tiny breakout turned out to be very temporary as black gold closed Friday's session below it. That's invalidation of the breakout attempt.
Second, recent increases materialized on declining volume, which raises doubts about the bulls' strength.
Third, despite last week's rebound, light crude is still trading below the 61.8% Fibonacci retracement, which also continues to serve as an additional resistance.
Fourth, the sell signals generated by the weekly indicators remain in the cards. However, that's not as important as the fact that the volume accompanying the recent white candlestick was smaller than the volume of previous declines.
Fifth, although crude oil moved above the long-term green resistance line, the month is not over yet, and we should not use this argument as a definitely bullish one at the moment. That can change only once we see the month to close above this important line.
Sixth, the current situation in crude oil futures.
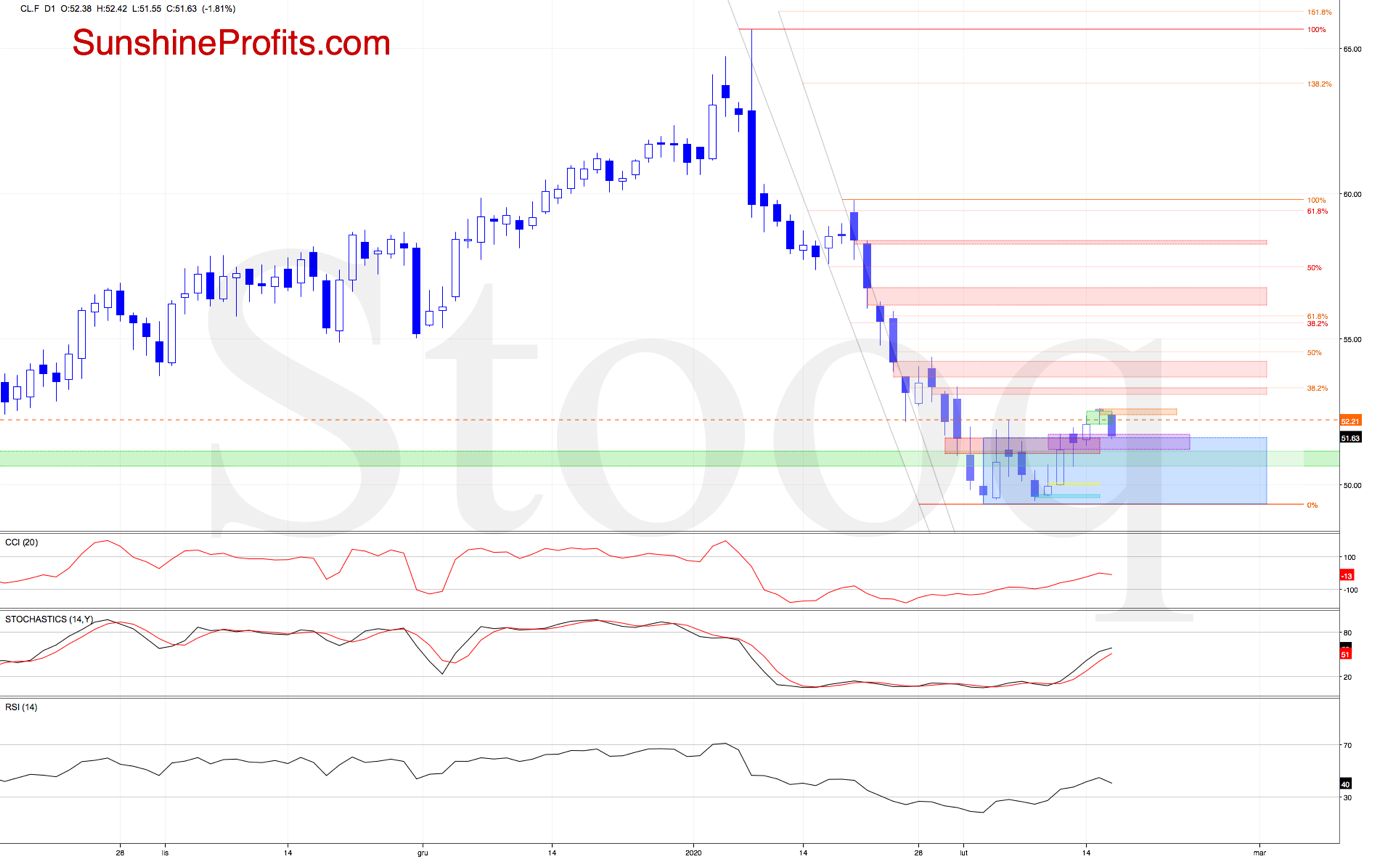
Looking at the above chart, we see that crude oil futures opened Monday well above Friday's close and last week's highs, creating a green gap. Despite this bullish factor, there was no bigger move to the upside. Instead, the futures created a bearish formation - the hanging man.
This candlestick pattern is created as a result of higher market opening, which turns out to be too high. The sellers in such cases take the initiative and push the price down. The buyers, however, pull it up with the last of their strength, and a candle's small body is the result, just as yesterday. Additionally, the candle features a long lower shadow - the longer, the better. It suggests that declines may be just around the corner.
At this point, it is worth keeping in mind that this is a single-candle formation, so it requires confirmation. A great example of such a confirmation is today's price action before the market open. What do we mean by that?
If the market opens lower right after the mentioned hanging man, it creates a bearish gap. Then, it may turn out that there are too many bulls with long positions who would be looking for selling opportunities.
When we take a look at the above chart, we clearly see that such price action took place earlier today. The red gap created at the beginning of the day triggered further deterioration, which resulted in an invalidation of the tiny breakout above last week's peak.
Additionally, crude oil futures closed the green gap created yesterday and slipped to the bullish gap formed on Thursday. It suggests that we'll likely see another bearish candlestick formation after the market closes - the evening star.
On top of that, when we take a closer look at the 4-hour chart below, we can notice even more bearish factors.
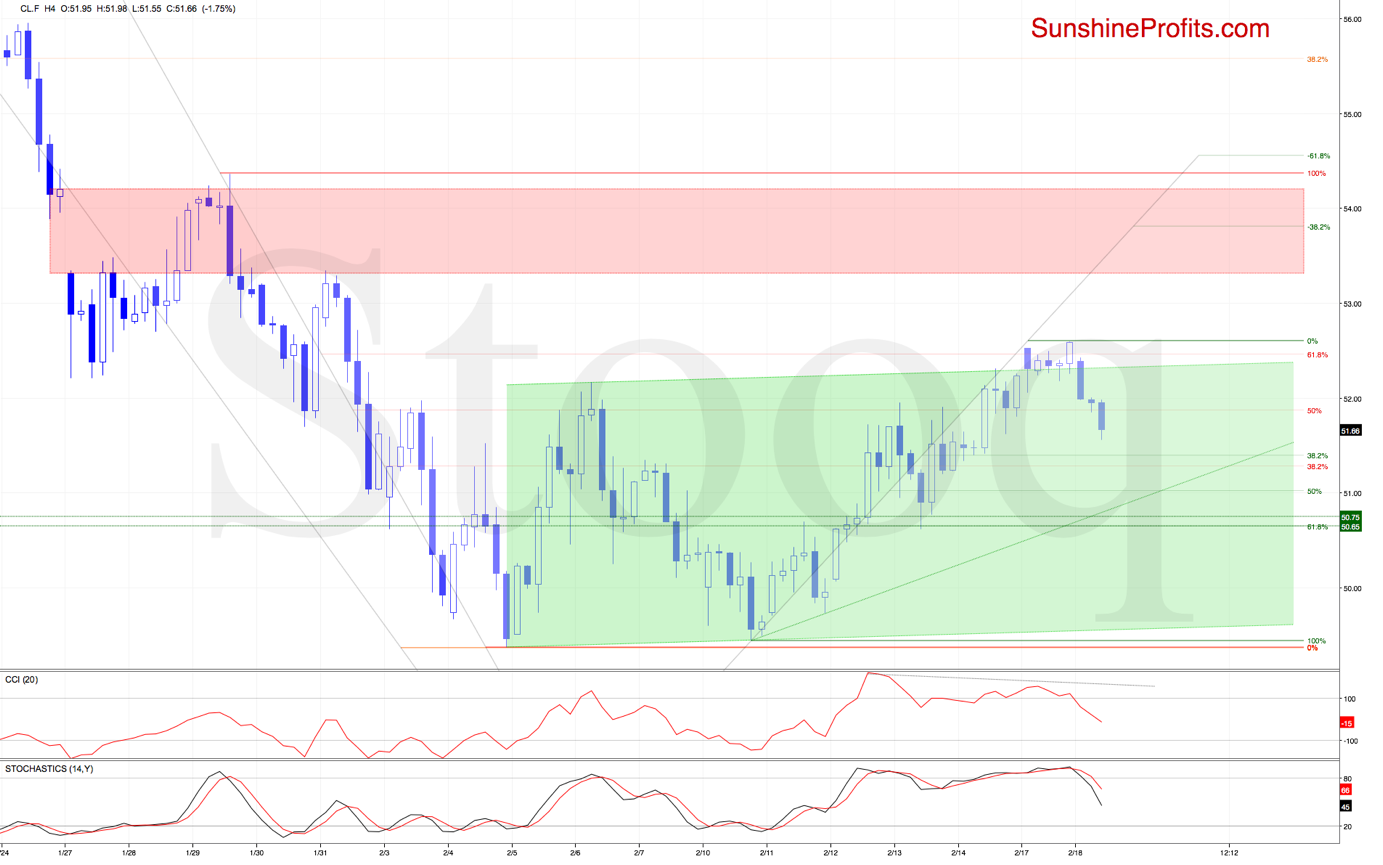
Thanks to yesterday's upswing, crude oil futures moved above both the 61.8% Fibonacci retracement that is based on the downward move started on January 29, and the upper border of the rising green trend channel.
Despite these encouraging factors, today's price action thwarted bullish plans for further increases. Why? Because the futures invalidated both breakouts, giving the sellers even more reasons to act. Additionally, the CCI and the Stochastic Oscillator generated their sell signals, suggesting that the way to lower levels is open.
How low could both the futures and crude oil that is likely to open the day with the bearish gap, go in the coming day(s)?
In our opinion, the first downside target will be around $50.65-$50.75 (in the case of the futures), where the first support zone and the 61.8% Fibonacci retracement are.
Nevertheless, taking into account all the above-mentioned factors (not only those marked on the 4h chart), we think that further deterioration and realization of the bearish scenario from our Oil Trading Alert published on Wednesday should not surprise us:
(...) we'll likely see the red gap created on February 3, 2020 tested later in the day.
This resistance was strong enough to stop the buyers five times in a row, which increases the probability that we could see another reversal and decline from here in the very near future. (...)
This scenario is also reinforced by the green zone based on the previous lows (...) Additionally, another move to the downside and a fresh 2020 low would be in line with the Elliott Wave Theory.
Summing up, it seems that it's too early to say that the outlook for crude oil is really bullish. Conversely, it seems that we'll see yet another quick decline in the following days. This move might become a much bigger move if black gold breaks to new yearly lows, but it's too early to say that today. If that is the case, we might enter yet another short position (after taking profits from the one that we are opening right now).
Trading position (short-term; our opinion): Short position in crude oil with a binding profit-take level at 50.03 and stop-loss level at $52.83
Thank you.
Nadia Simmons
Day Trading and Oil Trading Strategist
Przemyslaw Radomski, CFA
Editor-in-chief, Gold & Silver Fund Manager

