

Please note that due to market volatility, some of the key levels may have already been reached and scenarios played out.
Trading positions
No new position is justified from a risk/reward point of view.
Regarding risk management, it is always best to define your strategy according to your own risk profile. For some guidance on trade management, read one of my articles on that topic.
A recipe for a successful trading plan? Good risk appraisal combined with a pinch of discipline and prompt readjustments!
Targets One, Two, and Three Hit - A Trade Plan Explained
In my last projections published on May 9, following my previous analysis of the US crude oil inventories on May 5, I released a new oil trading alert to tell our subscribers that I was seeing a new potential opportunity to get long around what I tend to qualify as a landing space (support) highlighted by a yellow band. Such colour came up in reference to the Navy’s “Yellow Shirts,” who actually are the aircraft directors responsible for the safe movement of aircraft on the flight deck and in the hangar bay, communicating with pilots and other personnel with hand signals to move aircraft onto the catapults and off of the landing area safely.

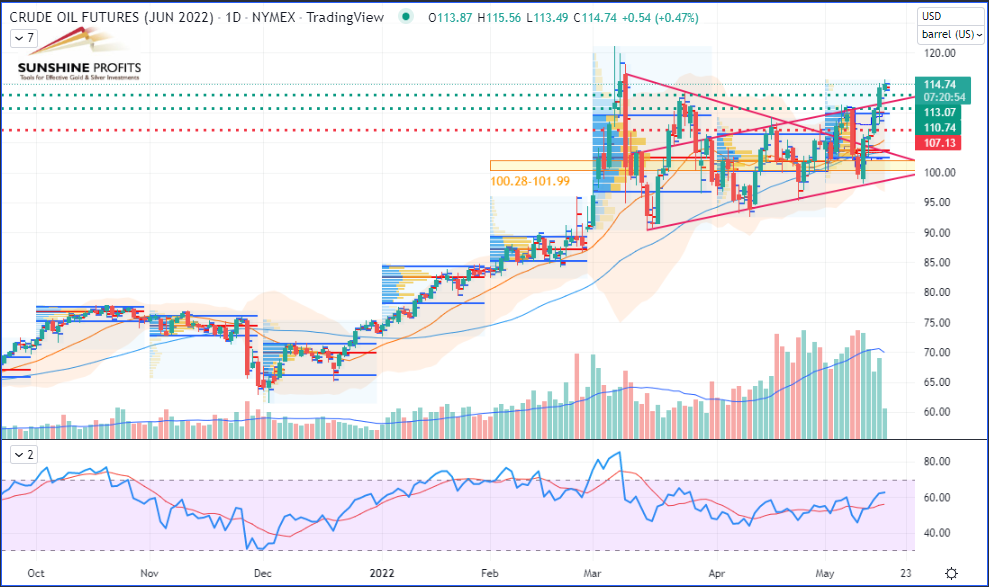
So, the landing space was expected around the $100 psychological mark, located at the middle point (median) of the previous range. It was after the market attempted a breakout from the upper side of the triangle pattern and before prices became weighed down by fears of a slowdown in Chinese demand due to the epidemic outbreak the country was experiencing while the US dollar index (DXY) was climbing the stairs. Therefore, my trading projections involved setting targets at three different levels ($107.76-110.74-113.07) on the June future contract (CLM22) while placing an initial stop just a tick below $96.52 (well under the lower side of the triangle).
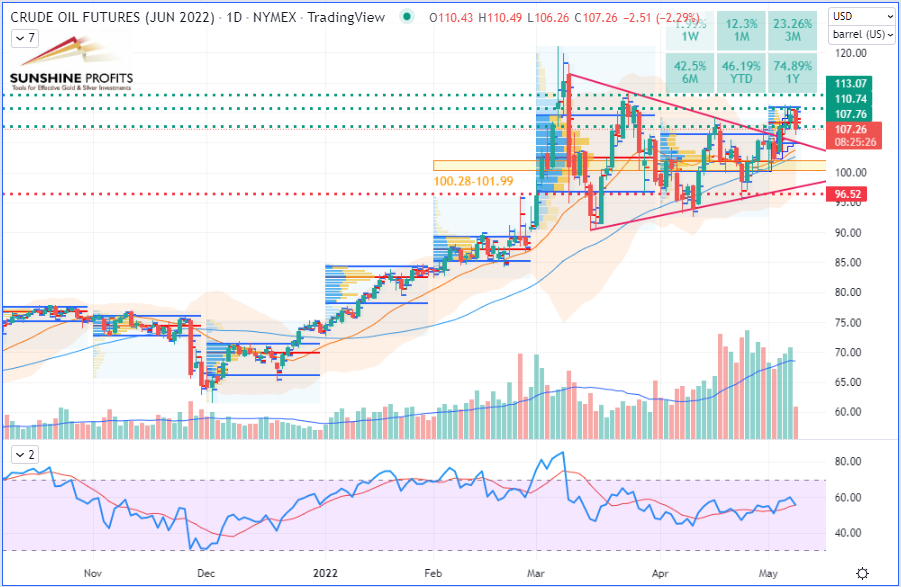 WTI Crude Oil (CLM22) Futures (June contract, daily chart)
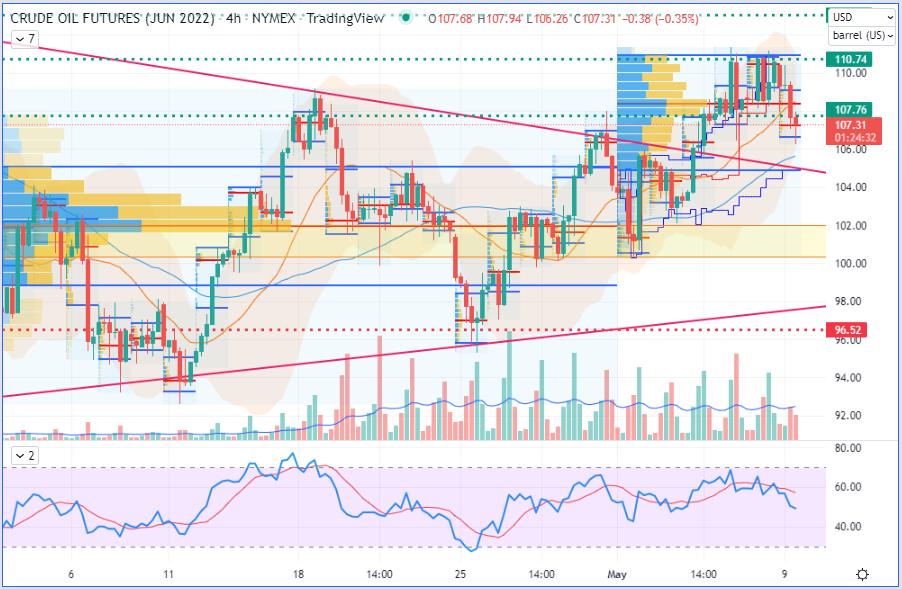 WTI Crude Oil (CLM22) Futures (June contract, 4H chart)
So, our entry was successfully triggered the next day, on May 10, when prices fell slightly below the landing space, before bulls re-entered, placing long orders to trigger the next bounce, as shown in the charts below.
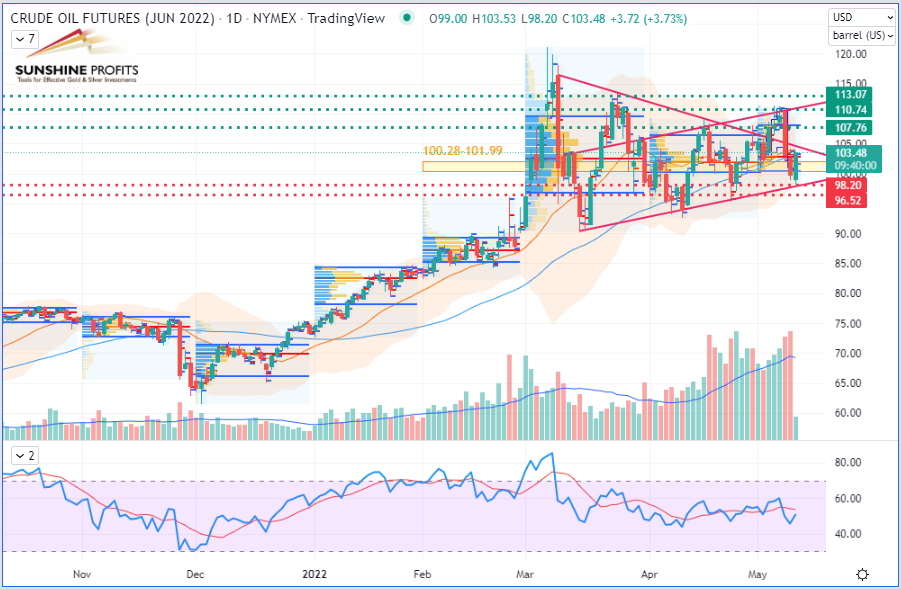 WTI Crude Oil (CLM22) Futures (June contract, daily chart)
 WTI Crude Oil (CLM22) Futures (June contract, 4H chart)
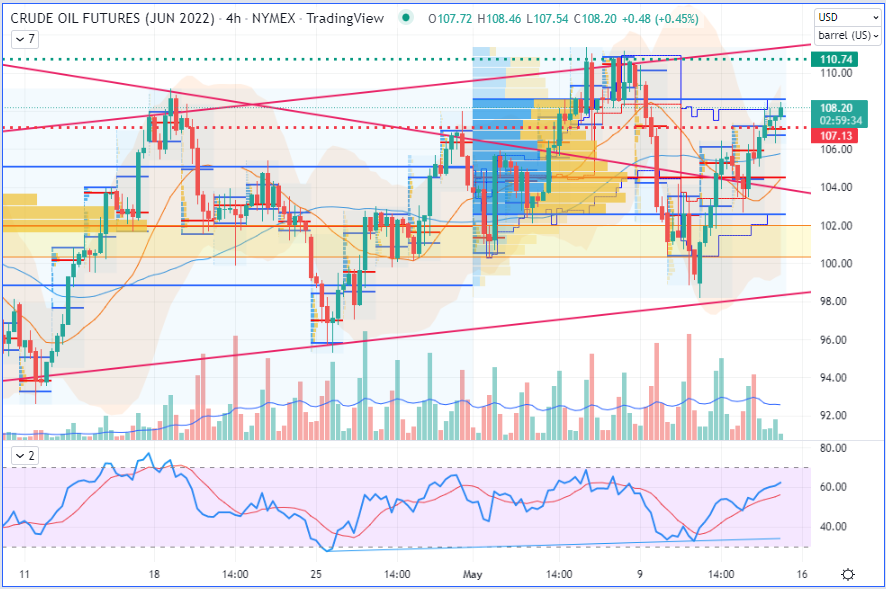
It is precisely when prices – also supported by fundamentals and geopolitics as detailed in this article that I published on May 11 – went back up with a strong momentum that our stop was lifted to its new level located just below $98.20 (previous swing low on the 4H chart).
Then, on May 12, the stop was dragged again (and again) higher (just below $104.62), as I sent an update just when at the US market open, prices were pushed further up by more active bulls.
On the charts below, to keep a clearer picture, I just displayed the updated stop and only the next target on the overall view (daily chart) and the zoomed-in view (4H chart).
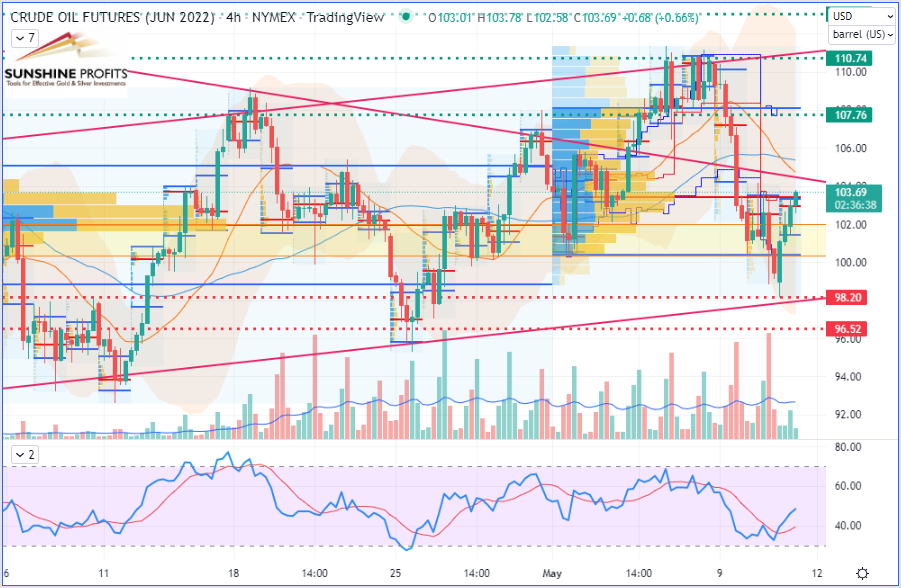
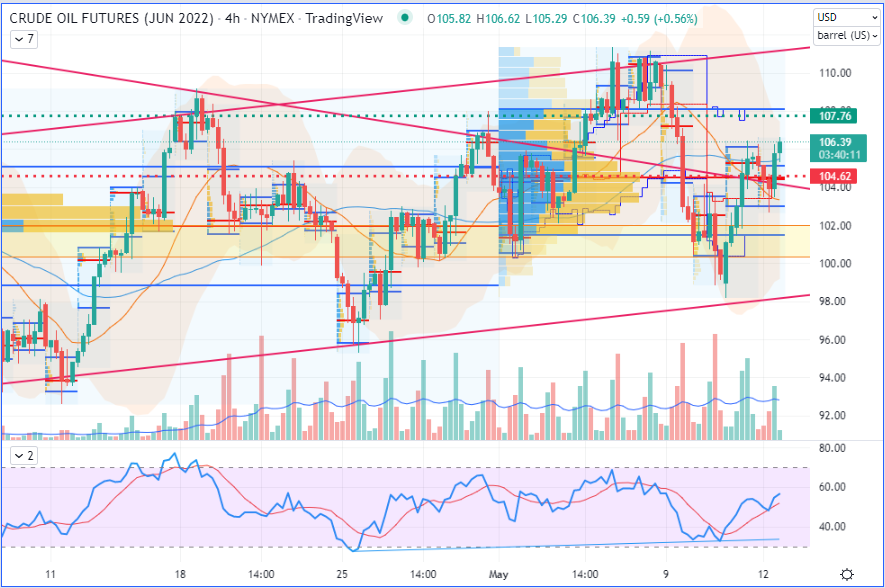 WTI Crude Oil (CLM22) Futures (June contract, 4H chart)
The following day, on May 13, as the market had hit our first target ($107.76) and even broken out of the previous day’s high ($108.13), I decided to drag it up one more time to the next level, located just below $107.13 – keeping it tight – for the rest of the position.
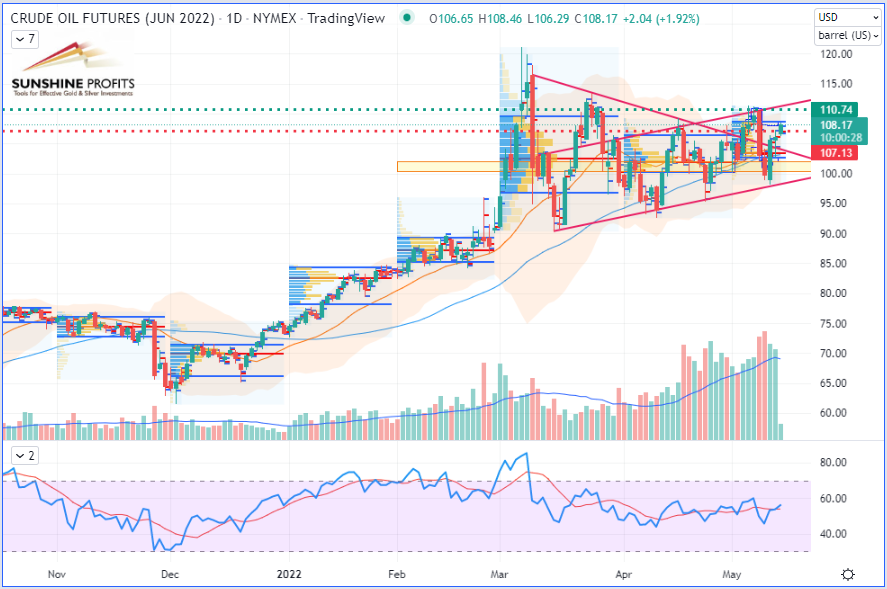 WTI Crude Oil (CLM22) Futures (June contract, daily chart)
 WTI Crude Oil (CLM22) Futures (June contract, 4H chart)
Finally, after almost kissing our second target on May 13, just before the weekend, the market rewarded us on Monday, May 16, as both our second and third targets were successfully and successively hit!
 WTI Crude Oil (CLM22) Futures (June contract, daily chart)
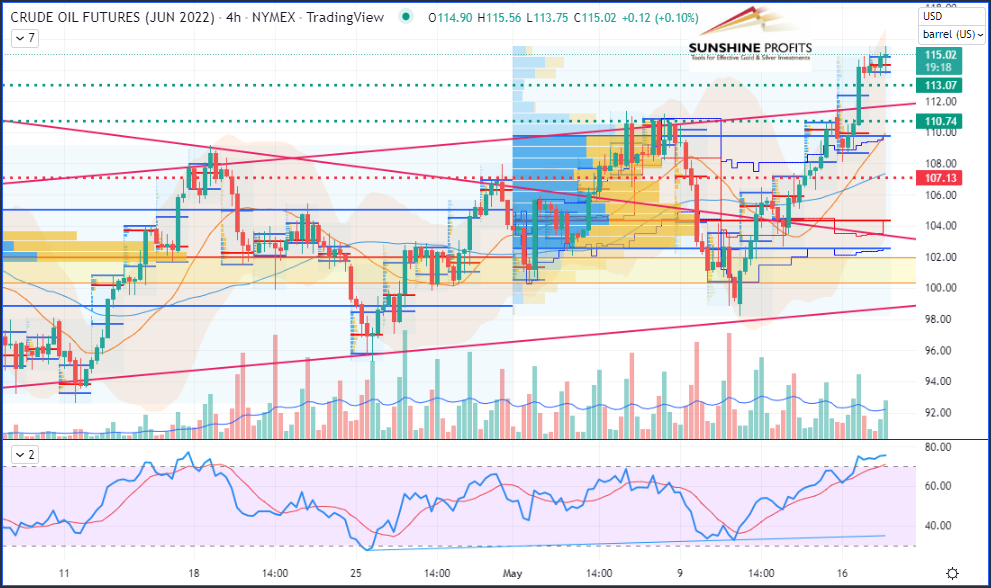 WTI Crude Oil (CLM22) Futures (June contract, 4H chart)
That’s all, folks, for today. I hope that you enjoyed this triple-winning trade!
As always, we’ll keep you, our subscribers well informed.
Thank you.
Sebastien Bischeri
Oil & Gas Trading Strategist

