

Trading position (short-term; our opinion): Short positions (with a stop-loss order at $54 and the initial downside target at $45.80) are justified from the risk/reward perspective.
On Monday, crude oil extended gains as the combination of Baker Hughes report and geopolitical tensions weighed on investors’ sentiment. As a result, light crude climbed to the long-term resistance line. Will it manage to stop bulls’ charge in the coming days?
Yesterday, the price of crude oil increased above $52 after oil investors reacted (in our opinion, too optimistic) to Friday Baker Hughes report, which showed the third weekly decline in a row. Although this is a positive event, we should keep in mind that the number of oil rigs in the U.S. increased from 316 in late May 2016 to 768 in mid-August 2017, which suggests that recent weekly drops (from 768 to 744) will not change the multi-month trend as soon as it may seem at the first sight. In our opinion, more important factor behind yesterday’s increase was Turkey's threat to cut off a major pipeline from Iraq's Kurdistan region to the outside world. Nevertheless, as long as crude oil flows, we think that reactions are exaggerated (the impact of the geopolitical events is generally temporary) and we’ll see lower prices of black gold in very near future. Will the technical picture confirm this scenario?
Crude Oil’s Technical Picture
Let’s take a closer look at the charts below and find out (charts courtesy of http://stockcharts.com).
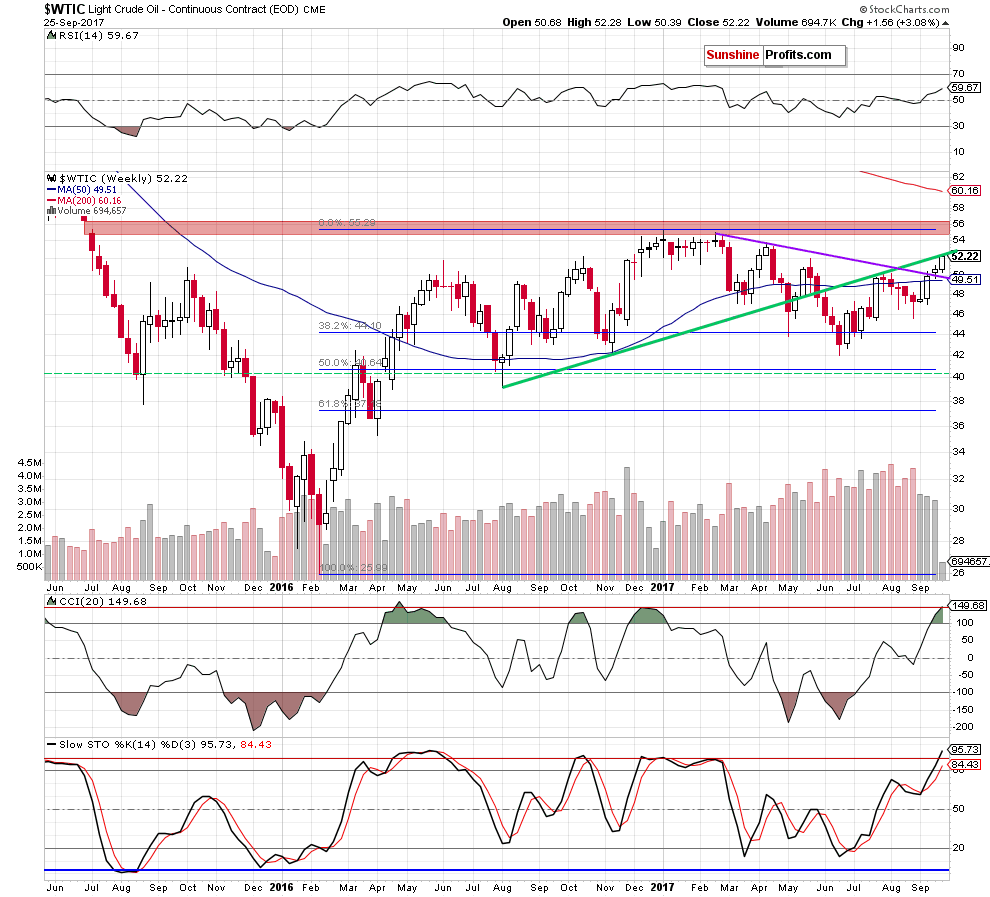
On the medium-term chart, we see that although crude oil extended gains, the commodity reached the previously-broken long-term green line, which looks like another verification of the earlier breakdown under this line.
When we take a closer look at the above chart, we can notice a similar situation at the end of July. Back then, this important resistance was strong enough to stop oil bulls and trigger declines in the following weeks - despite the fact that the indicators were at much lower levels than now. Additionally, the CCI and the Stochastic Oscillator increased recently to the levels that we saw at the beginning of the year - just before the start of the downward move, which increases the probability that reversal is just around the corner – especially when we factor in the fact that the size of volume is decreasing from week to week (this observation raises doubts about the strength of the rally).
And speaking about indicators…. when we focus on the daily RSI, we can see an interesting regularity.
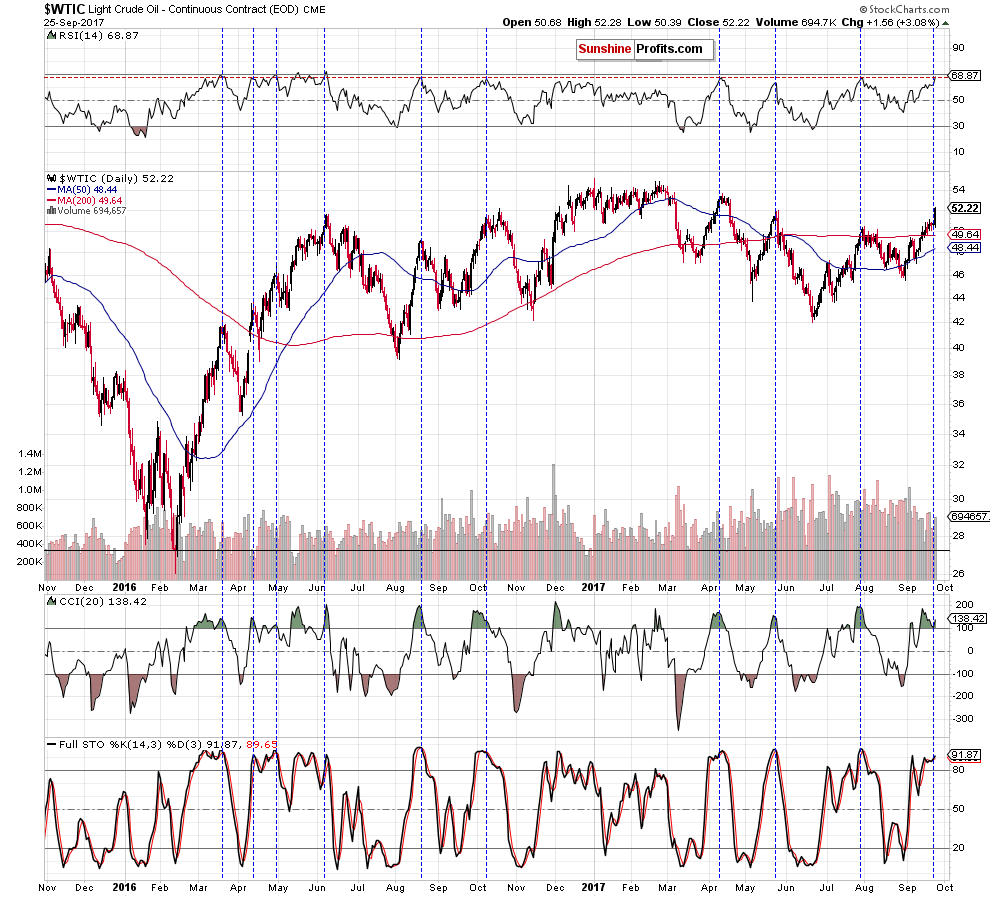
As you see on the above chart, almost all RSI increases to around 70 since the beginning of 2016 have resulted in reversals in the following days (we marked then with blue vertical, dashed lines), which increases the probability that the history will repeat itself once again and crude oil will decline in very near future.
This scenario is also reinforced by the position of the CCI, the Stochastic Oscillator and the current situation in the oil-to-stocks ratio.
Relationsheep between crude oil and general stock market.
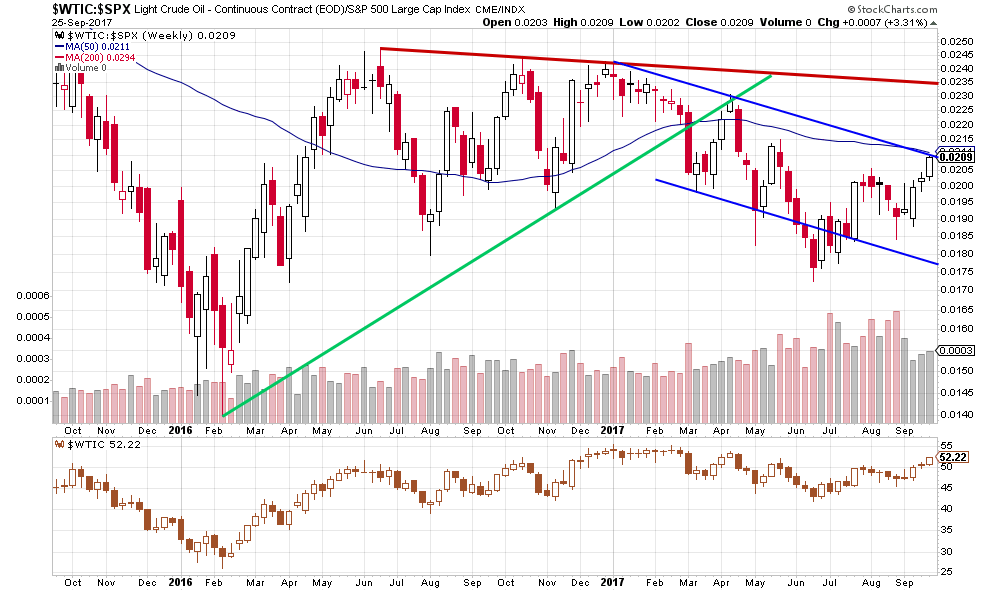
Looking at the weekly chart, we see that although the ratio moved higher, it climbed to very important resistances – the upper border of the blue declining trend channel and the 50-week moving average, which together could stop bulls later this week and trigger a reversal.
What does it mean for light crude? Taking into account positive relationship between the commodity and the ratio, we think that declines the latter case will translate into downward move in the case of black gold – similarly to what we saw in the past.
Connecting the dots, we think that reversal in crude oil is very likely and to avoid unnecessary closure of our short position we decided to move the stop-loss order to $54 – slightly above the April high.
Summing up, crude oil moved higher and increased to previously-broken long-term green line, which looks like another verification of the earlier breakdown. This scenrio is reinforced by the current position of the indicators, the size of olume, which accompanied recent incrreases and the current situation in the oilto-stocks ratio. Therefore, we believe that short positions continue to be justified from the risk/reward perspective.
Very short-term outlook: bearish
Short-term outlook: mixed with bearish bias
MT outlook: mixed
LT outlook: mixed
Trading position (short-term; our opinion): Short positions (with a stop-loss order at $54 and the initial downside target at $45.80) are justified from the risk/reward perspective. We will keep you – our subscribers – informed should anything change.
Thank you.
Nadia Simmons
Forex & Oil Trading Strategist
Przemyslaw Radomski, CFA
Founder, Editor-in-chief, Gold & Silver Fund Manager
Gold & Silver Trading Alerts
Forex Trading Alerts
Oil Investment Updates
Oil Trading Alerts

