

Trading position (short-term; our opinion; levels for crude oil’s continuous futures contract): Full (100% of the regular position size) speculative short positions in crude oil are justified from the risk to reward point of view stop loss $45.63 at and $30.22 as the initial target price.
After soaring yesterday, crude oil corrected and moved lower – it’s now trading lower than when we wrote yesterday’s analysis. Does it mean that the rally is over? Well, the above – by itself, doesn’t mean it, but it seems that yesterday’s vaccine testing news and greater certainty in markets were not yet enough to propel oil higher in the long term.
You see, crude oil has likely rallied due to the initial optimistic reaction to the outcome of the U.S. election combined with the market’s response to the very promising Covid-19 vaccine test results.
These were one-time events: the decrease in uncertainty and the announcement. Consequently, they are unlikely to trigger any additional price increases. This is especially the case with the general stock market – that rallied along with crude oil yesterday – already having erased most of the declines and doing so in the practically most bearish way imaginable.
And why would the general stock market decline from here? After all it soared above the previous highs…
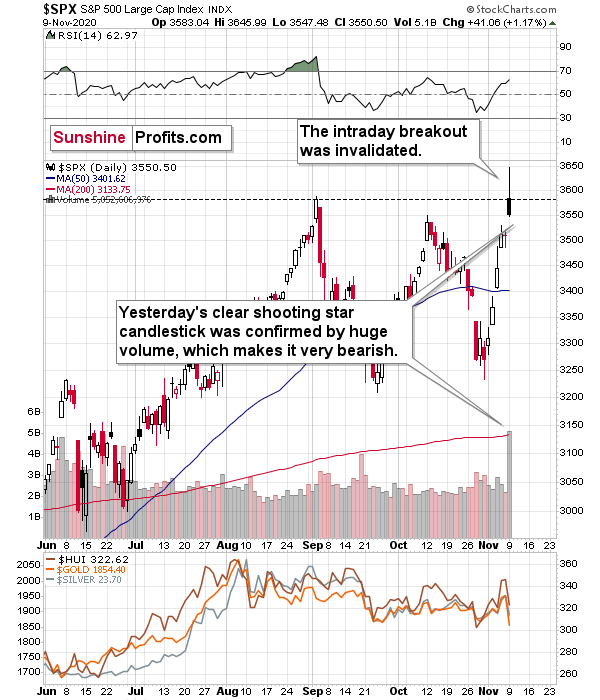
It did, but only initially. The S&P 500 index failed to hold onto its gains, and it erased most of the rally before the session was over. It declined back below the previous 2020 high, which means that it invalidated the initial breakout. The bearish forces were too strong.
If the bearish forces were too strong right now – given both above-mentioned bullish boosts – then the bulls are unlikely to push stocks above their September high anytime soon.
Technically speaking, we just saw a profound shooting star reversal candlestick, which formed on huge volume, as well as invalidation of the breakout above an important level. This is a very bearish combination.
Consequently, I think that crude oil will get a powerful bearish push from the stock market and that it will slide further. Not necessarily today, as yesterday’s decline might require a quick breather, but the following days and weeks look bleak.
Moreover, the USD Index appears to be bottoming in a way that’s very similar to what we saw in 2008 and 2011.
Last week’s plunge was dramatic, and the USD Index even managed to invalidate its previous short-term breakout. This is bearish, but there are more powerful bullish forces that remain intact, so the above didn’t change the outlook.

The quite obvious – and important – detail that we see in the above chart is that the USD Index didn’t slide to new medium-term lows, let alone the previously broken medium-term declining support line. Short-term indications are not as important as medium or long-term ones…and speaking of the latter – let’s zoom out.
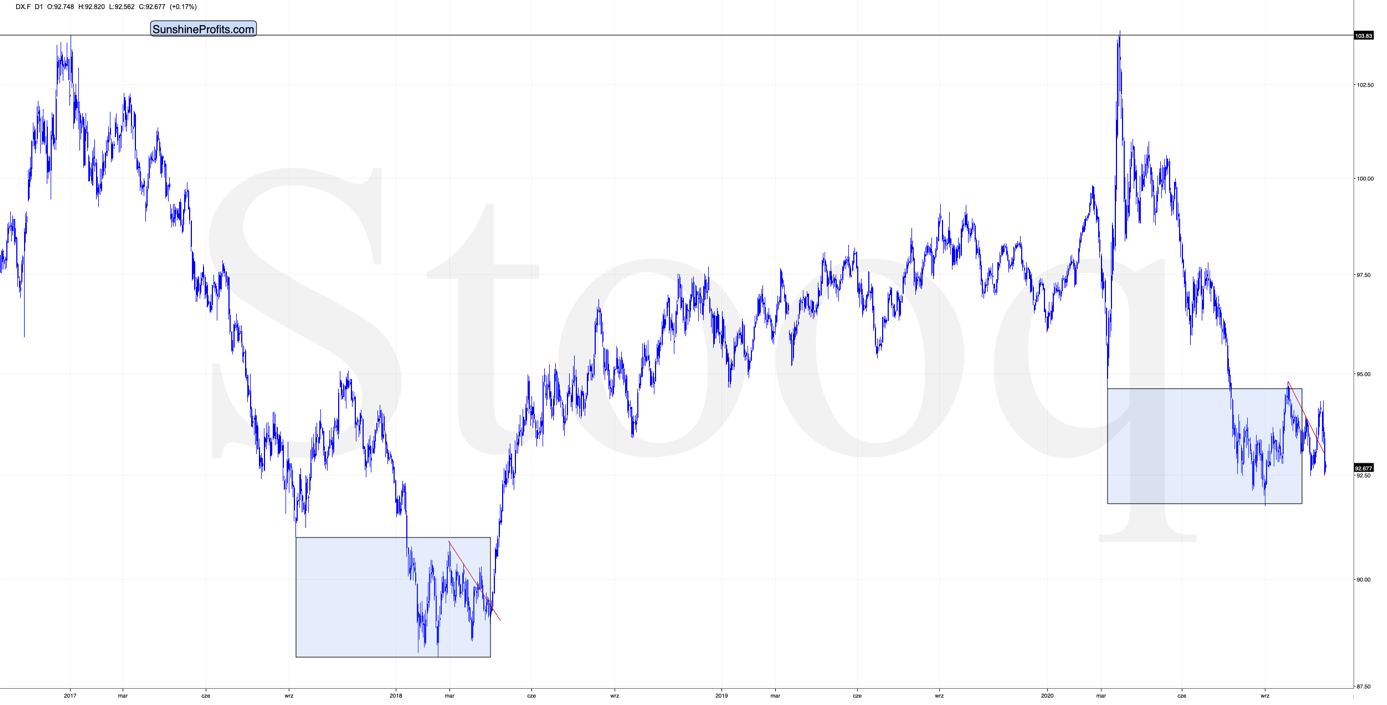
Please note that the shape of the current broad bottom is almost identical to what we saw in early 2018. The rectangles on the above chart are 100% identical. The left rectangle is based on the September 2017 low, the 2018 low, and final low of the broad bottom. Copying this rectangle and attaching it to the March 2020 bottom provides us with an almost 100% precise downside target for the recent low. The follow-up highs (March 2018 and September 2020) are very closely aligned as well.
Moreover, in both cases, the initial bottom was not the final one, but the final one followed shortly. We then saw (again, in both cases), a relatively sharp rally that failed and then another low that was not as low as the previous bottom. Then there was yet another fake rally (and a fake breakout above the declining red resistance line). This breakout was then invalidated and what followed was THE final bottom in the USD Index.
Oh, and both declines started from the same level (about 103.8).
Yes, the situation is as ridiculously similar as I described above. But wait, there’s more!
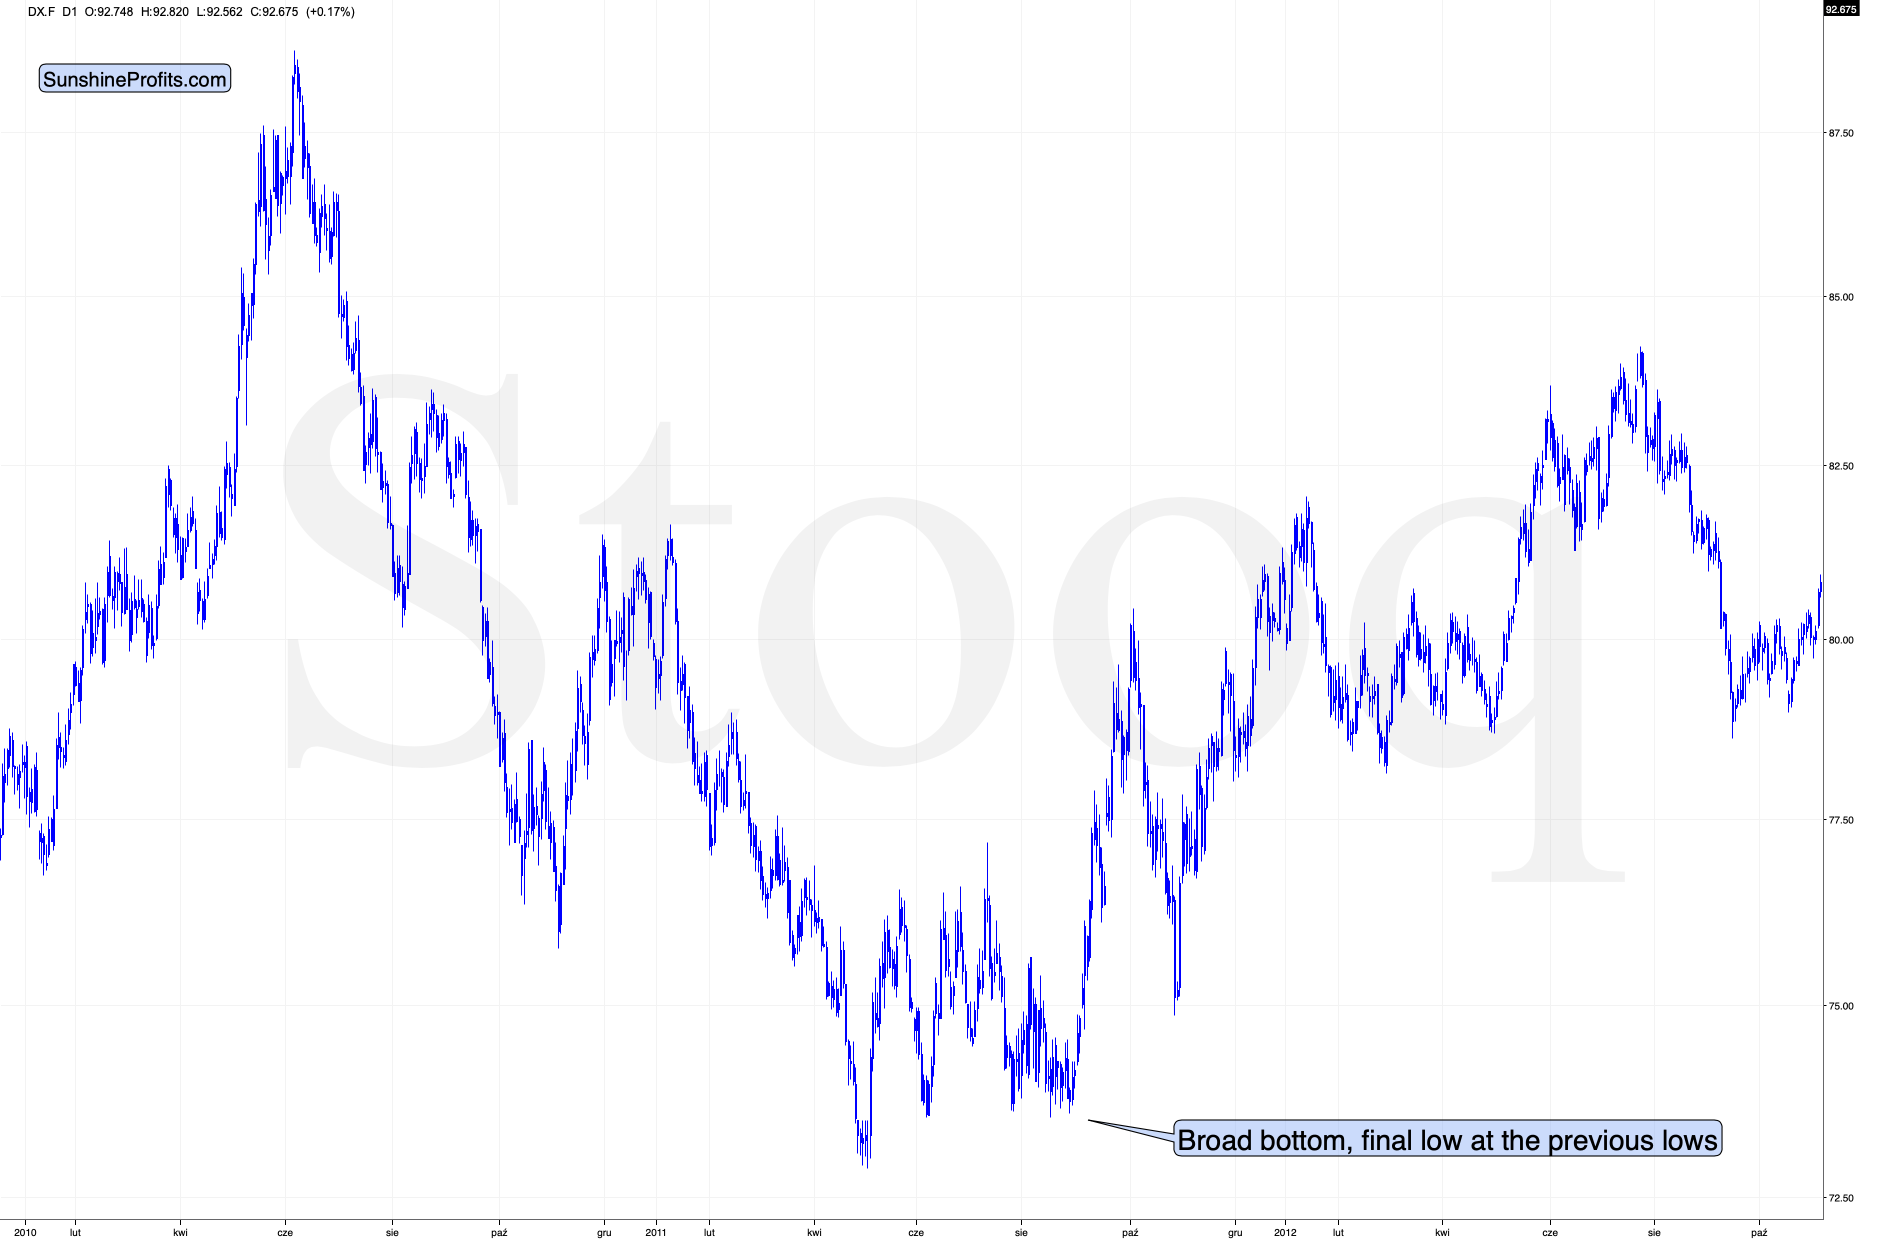
The bottoming pattern in 2011 is also very similar to what we see right now and what we saw earlier this year. The final bottom even took place at the previous lows – just like what we saw yesterday. This analogy is particularly important because August 2011 is when gold formed its multi-year high.
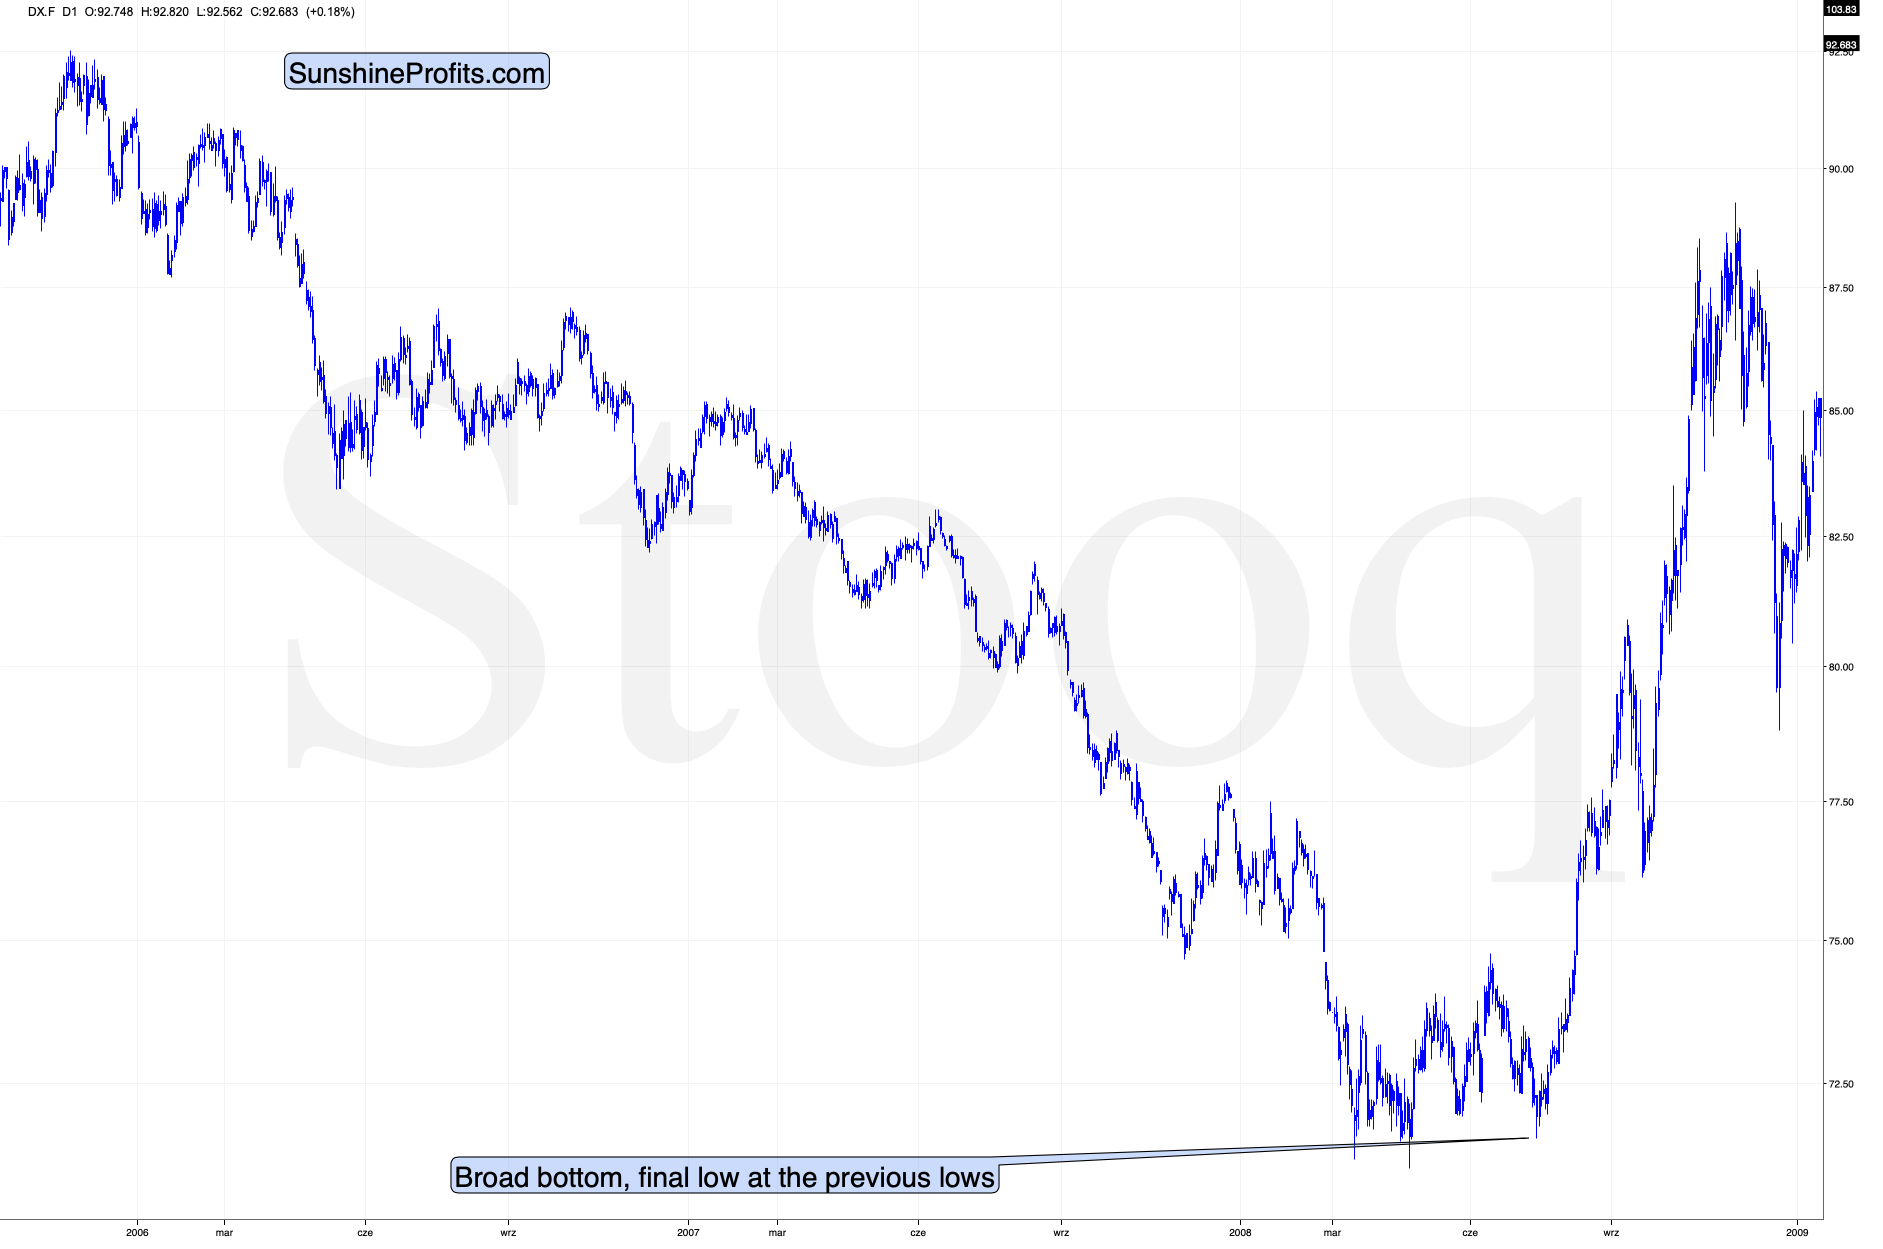
Back in 2008, the USD Index bottomed in a very similar manner. And yes, the final bottom formed close to the previous lows – once again just like what we saw this week.
So, does the invalidation of the short-term breakout in the USD Index really make the outlook bearish right now? In light of the above powerful analogies to the past major bottoms – absolutely not.
And as the USD Index soars, crude oil is likely to slide – that’s what’s been taking place in the previous weeks, after all.
Crude oil is likely to decline based on both factors: declining stocks and a rising USD Index.
Did this week’s sharp upswing change anything from the technical point of view?
It didn’t. The volatile nature of the move and the analogy to the previous first session after the U.S. presidential elections suggest that one should be skeptical towards yesterday’s price action. Crude oil has recently pushed the small breakout above the 61.8% Fibonacci retracement, and it invalidated the move above the September highs, and it could easily do this once again.
If crude oil ends today’s session without declining, the outlook might change, but so far, the points that we made previously remain up-to-date.
Most importantly:
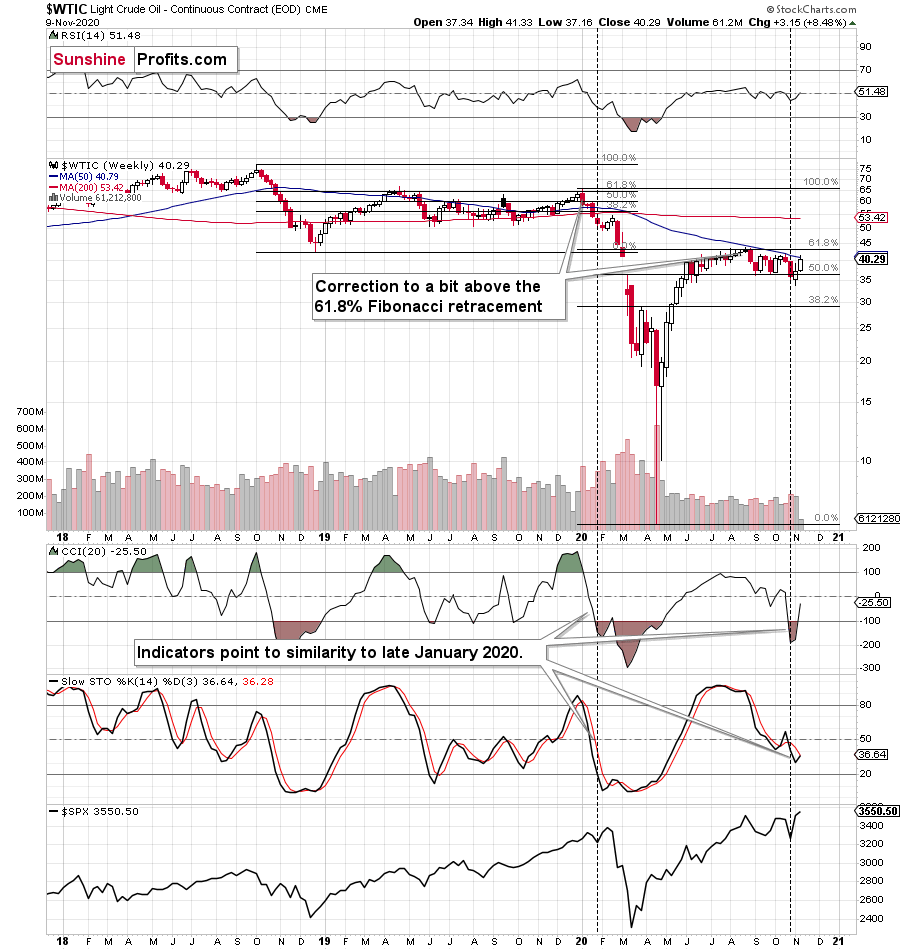
The situation remains similar to what we’ve witnessed in Q1 2020, with not just the breakdown in crude oil, but the fact that it had first corrected slightly above the 61.8% of the preceding decline and that stocks were forming a double-top pattern.
Of course, we’ll be aware of the final point (stock’s double top) only after they decline further. However, the shape of the price moves (lower part of the above chart) is already similar.
To summarize, for the upcoming weeks, the outlook for crude oil remains bearish. If crude oil is able to keep yesterday’s strength for longer, the above might change, but for the time being, the bearish outlook remains intact.
As always, we’ll keep you, our subscribers well informed.
Trading position (short-term; our opinion; levels for crude oil’s continuous futures contract): Full (100% of the regular position size) speculative short positions in crude oil are justified from the risk to reward point of view stop loss $45.63 at and $30.22 as the initial target price.
In the future contracts that are more distant than the current contract, we think adding the premium (the difference between the July and other contracts) to both: stop-loss and initial target prices is justified.
Thank you.
Przemyslaw Radomski, CFA
Editor-in-chief

