

Trading position (short-term; our opinion; levels for crude oil’s continuous futures contract): Full (100% of the regular position size) speculative short positions in crude oil are justified from the risk to reward point of view stop loss $45.63 at and $30.22 as the initial target price.
With further vaccine news leading to hope of a fuel demand recovery and U.S. President-elect Joe Biden beginning his transition to the White House, the price of crude oil once again soared today and it might be tempting to view this price move as particularly bullish. But let’s consider the facts.
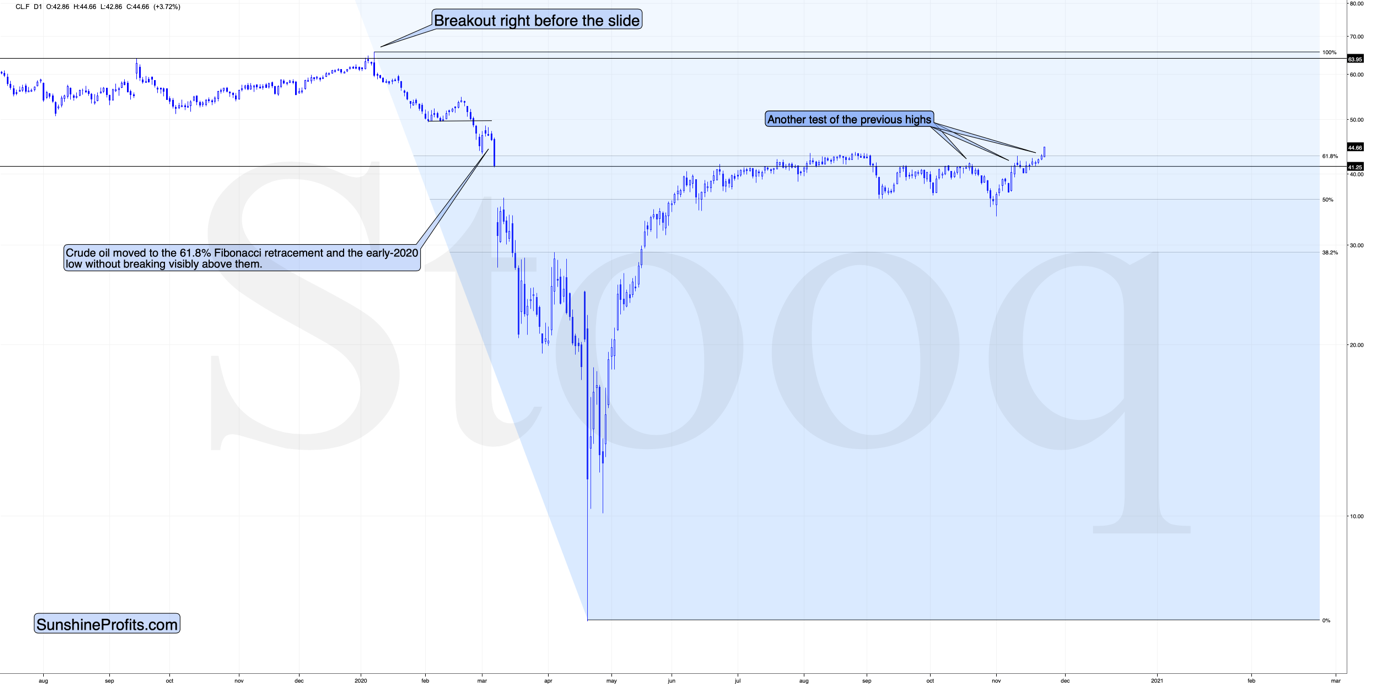
The first major fact is that today’s rally above the 61.8% Fibonacci retracement is just an intraday phenomenon at this time. It’s definitely not confirmed.
The second major fact is that all previous August – November attempts to move above this retracement were invalidated shortly.
The third major fact is that the 2020 slide started with a breakout that failed to be confirmed – that’s exactly what happened in the first days of 2020.
Consequently, the current move higher should not be viewed as a game-changer, but rather as a jump in intraday volatility. As the breakout remains unconfirmed, the outlook remains bearish.
As well, let’s keep in mind that a rallying U.S. Dollar Index is likely to trigger declines in crude oil prices. My previous comments on the former remain up-to-date:
The recent plunge was dramatic, and the USD Index even managed to invalidate its previous short-term breakout. This was bearish, but there are more powerful bullish forces that remain intact, so the above didn’t change the outlook.
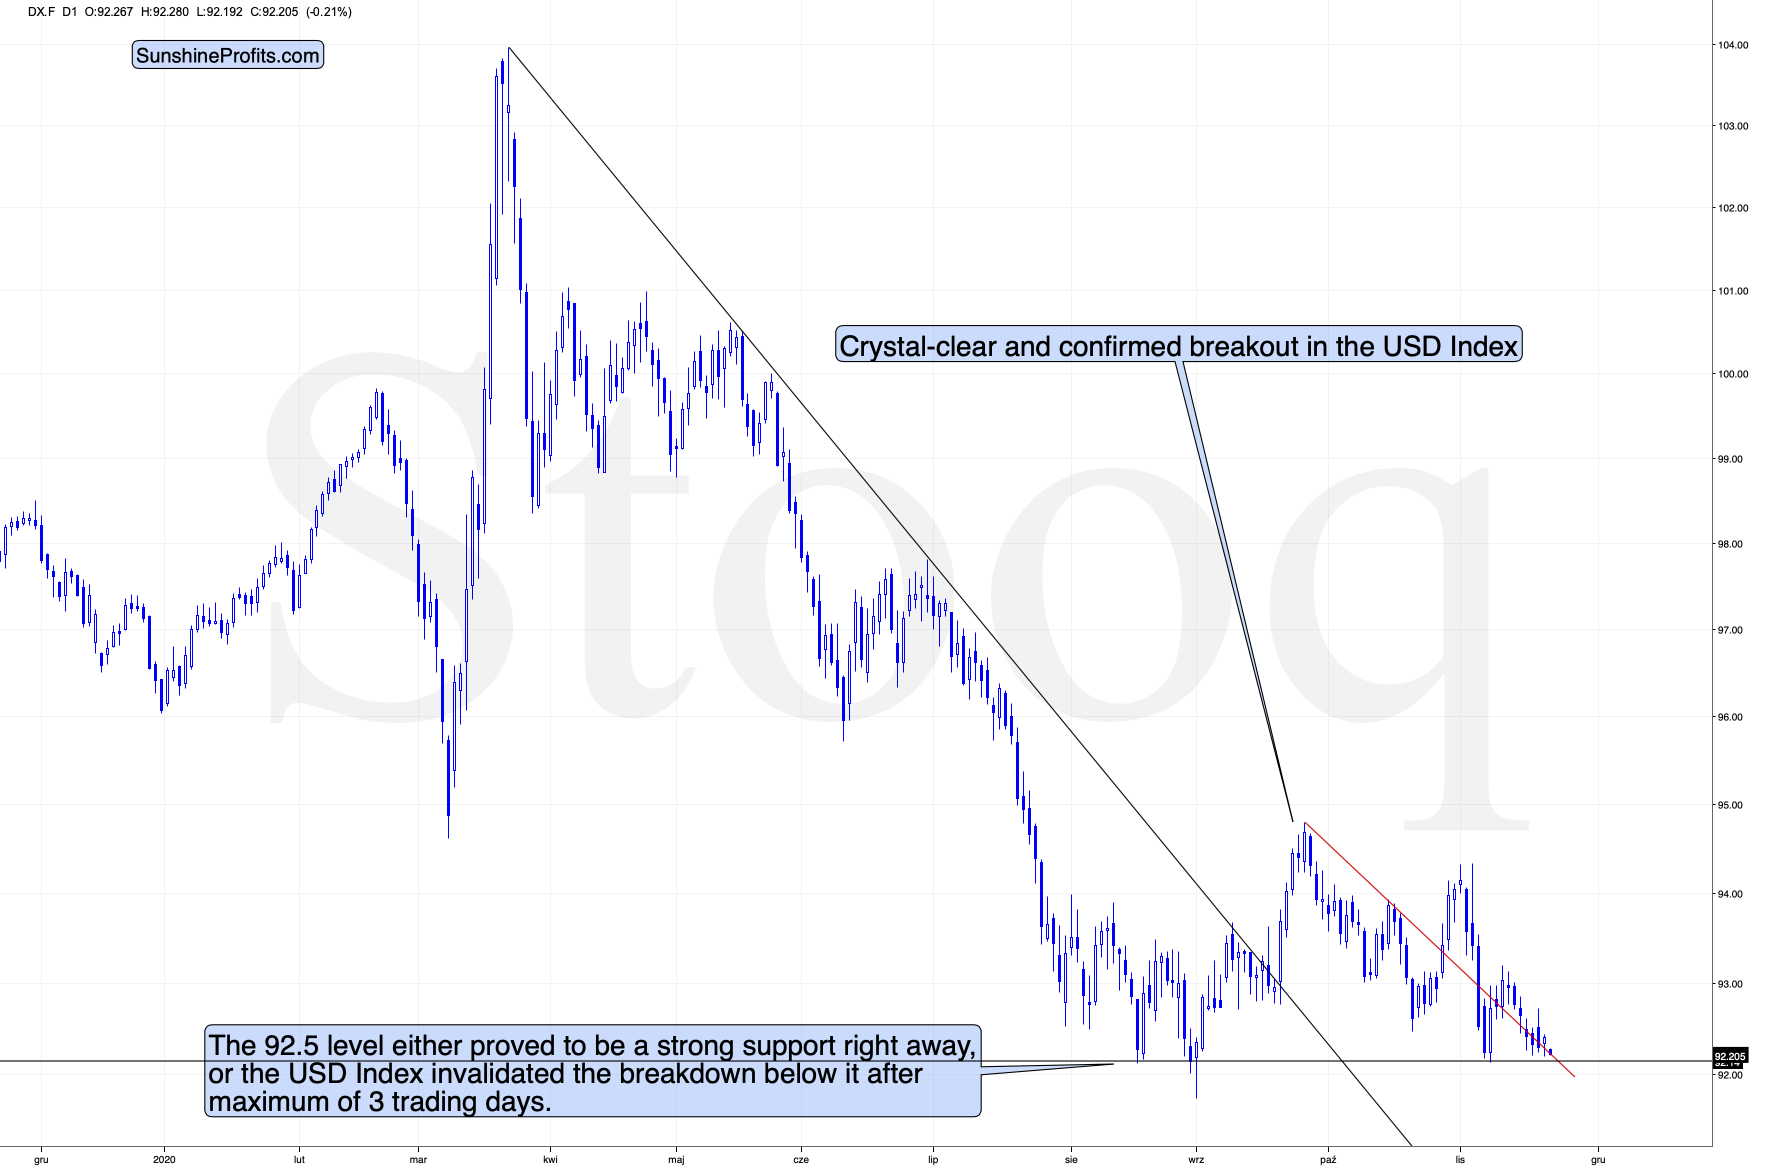
At the moment of writing these words, the U.S. currency is testing the previous lows. It’s very near to the last daily close price of 2020. At the same time, the USDX is below the 92.5 level, which is much more important than it seems at the first sight. Previously, in 2020, the USDX managed to stay below this level for a maximum of 2 sessions. This is currently the fifth session below it. Normally, this could be viewed as an early sign of a breakdown, but I don’t think this would be the proper interpretation.
Given the Thanksgiving seasonality, and the fact that the small breakdown below 92.5 didn’t result in a breakdown below the previous price lows, it’s doubtful that there are any bearish implications at all. Besides, that’s not even the most important detail from the precious metals investors’ point of view.
The most important detail is that all these bearish moves in the USDX failed to trigger any decent rallies in gold, which shows that the latter simply doesn’t want to rally from here.
Moreover, short-term indications are one thing, but it’s important to remember that they are not as important as medium or long-term ones…and speaking of the latter – let’s zoom out.
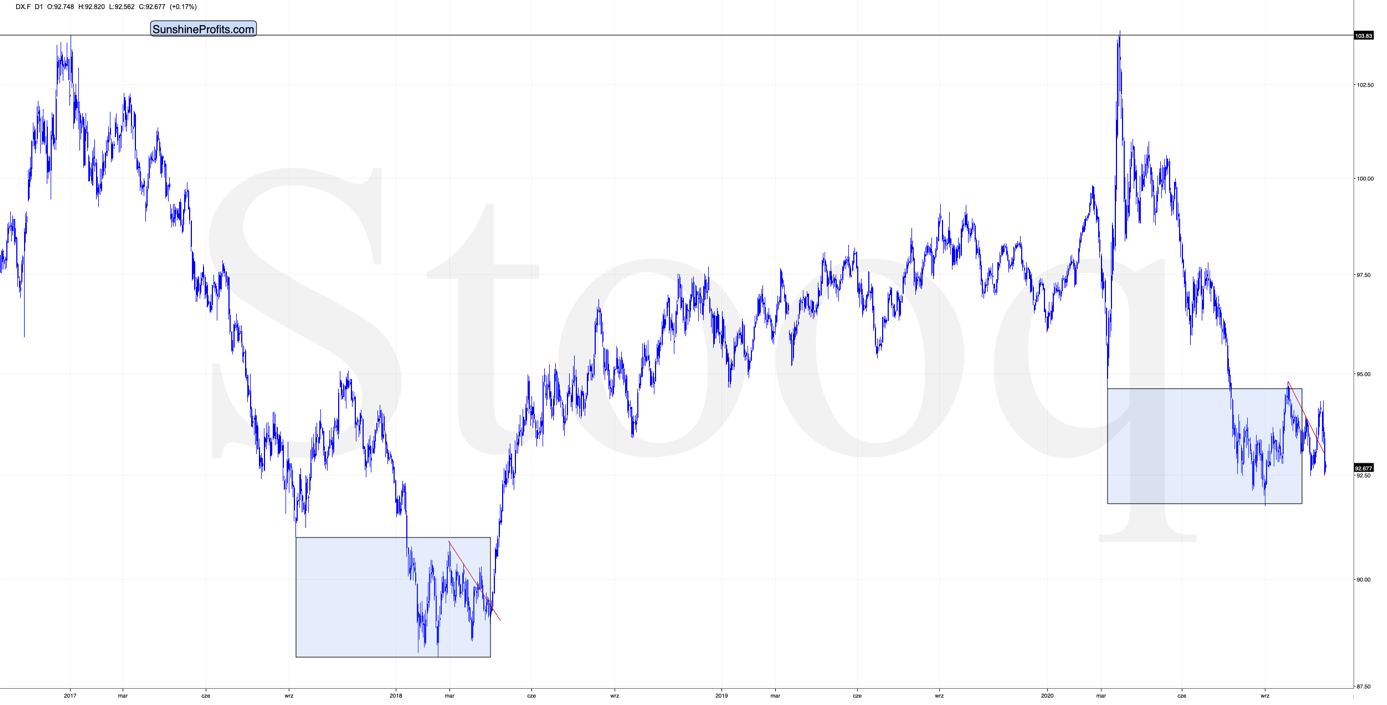
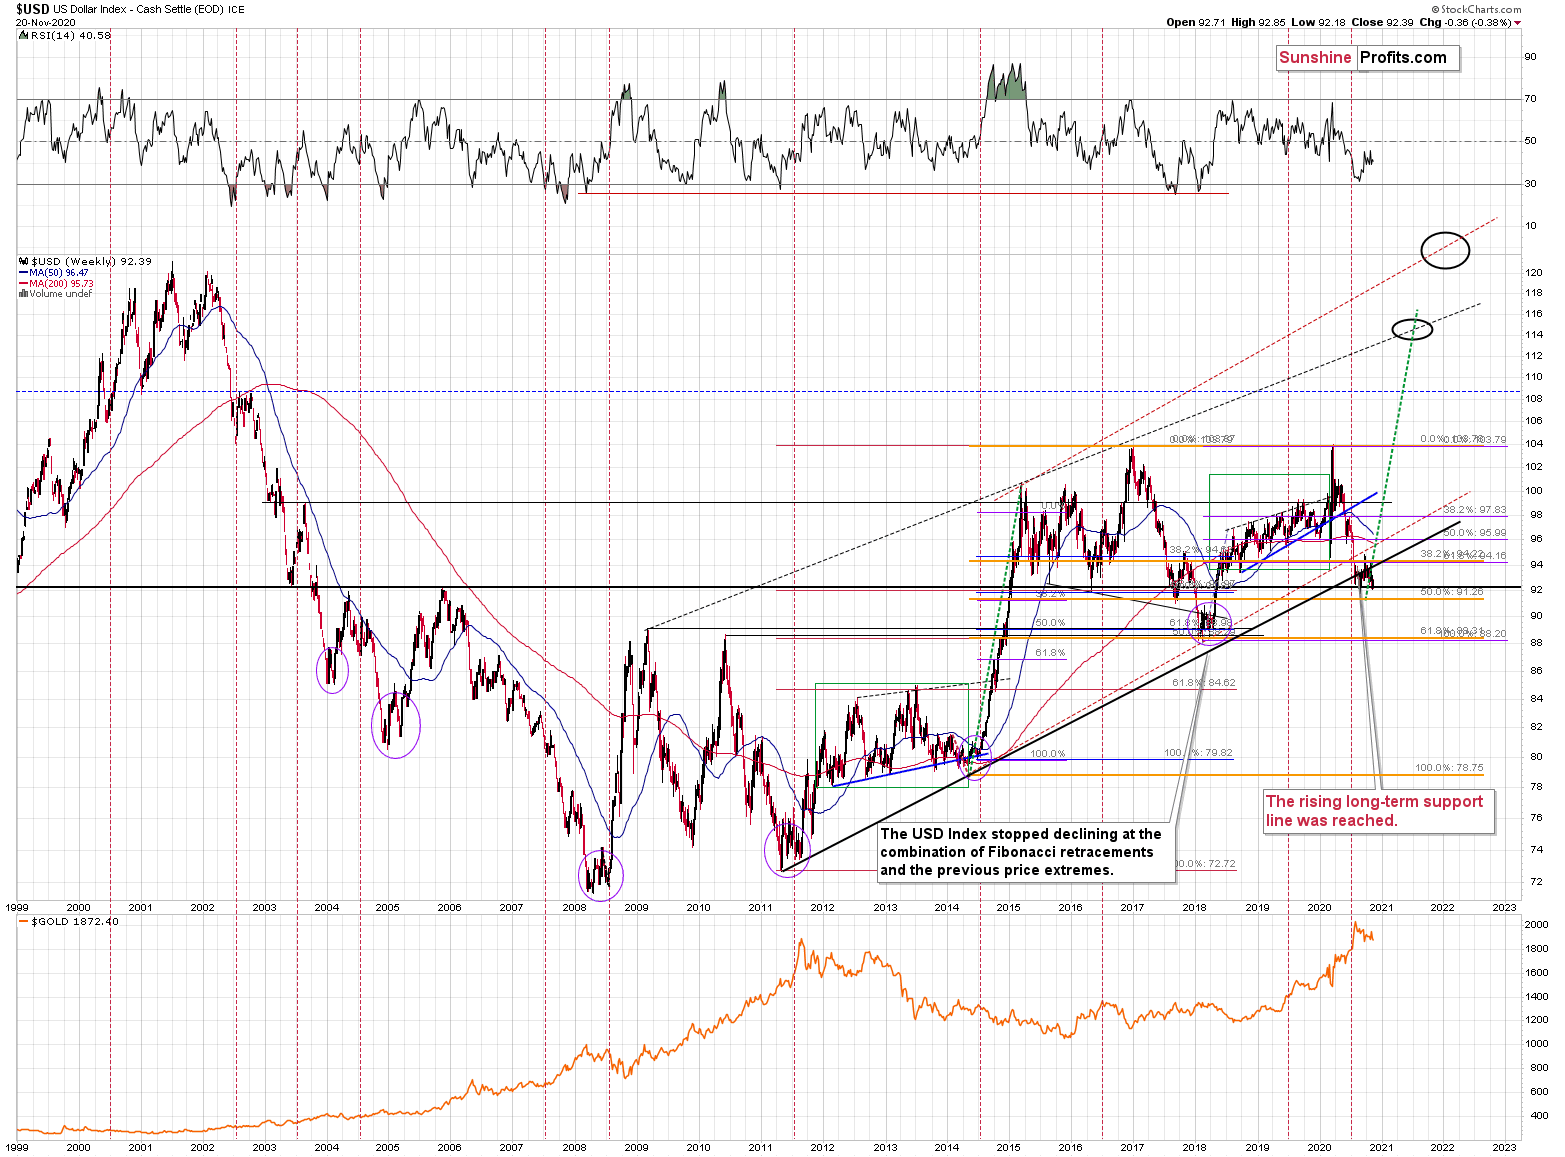
Please note that the shape of the current broad bottom is almost identical to what we saw in early 2018. The rectangles on the above chart are 100% identical. The left rectangle is based on the September 2017 low, the 2018 low, and final low of the broad bottom. Copying this rectangle and attaching it to the March 2020 bottom provides us with an almost 100% precise downside target for the recent low. The follow-up highs (March 2018 and September 2020) are very closely aligned as well.
Moreover, in both cases, the initial bottom was not the final one, but the final one followed shortly. We then saw (again, in both cases), a relatively sharp rally that failed and then another low that was not as low as the previous bottom. Then there was yet another fake rally (and a fake breakout above the declining red resistance line). This breakout was then invalidated and what followed was THE final bottom in the USD Index.
Oh, and both declines started from the same level (about 103.8).
Yes, the situation is as ridiculously similar as I described above. But wait, there’s more!
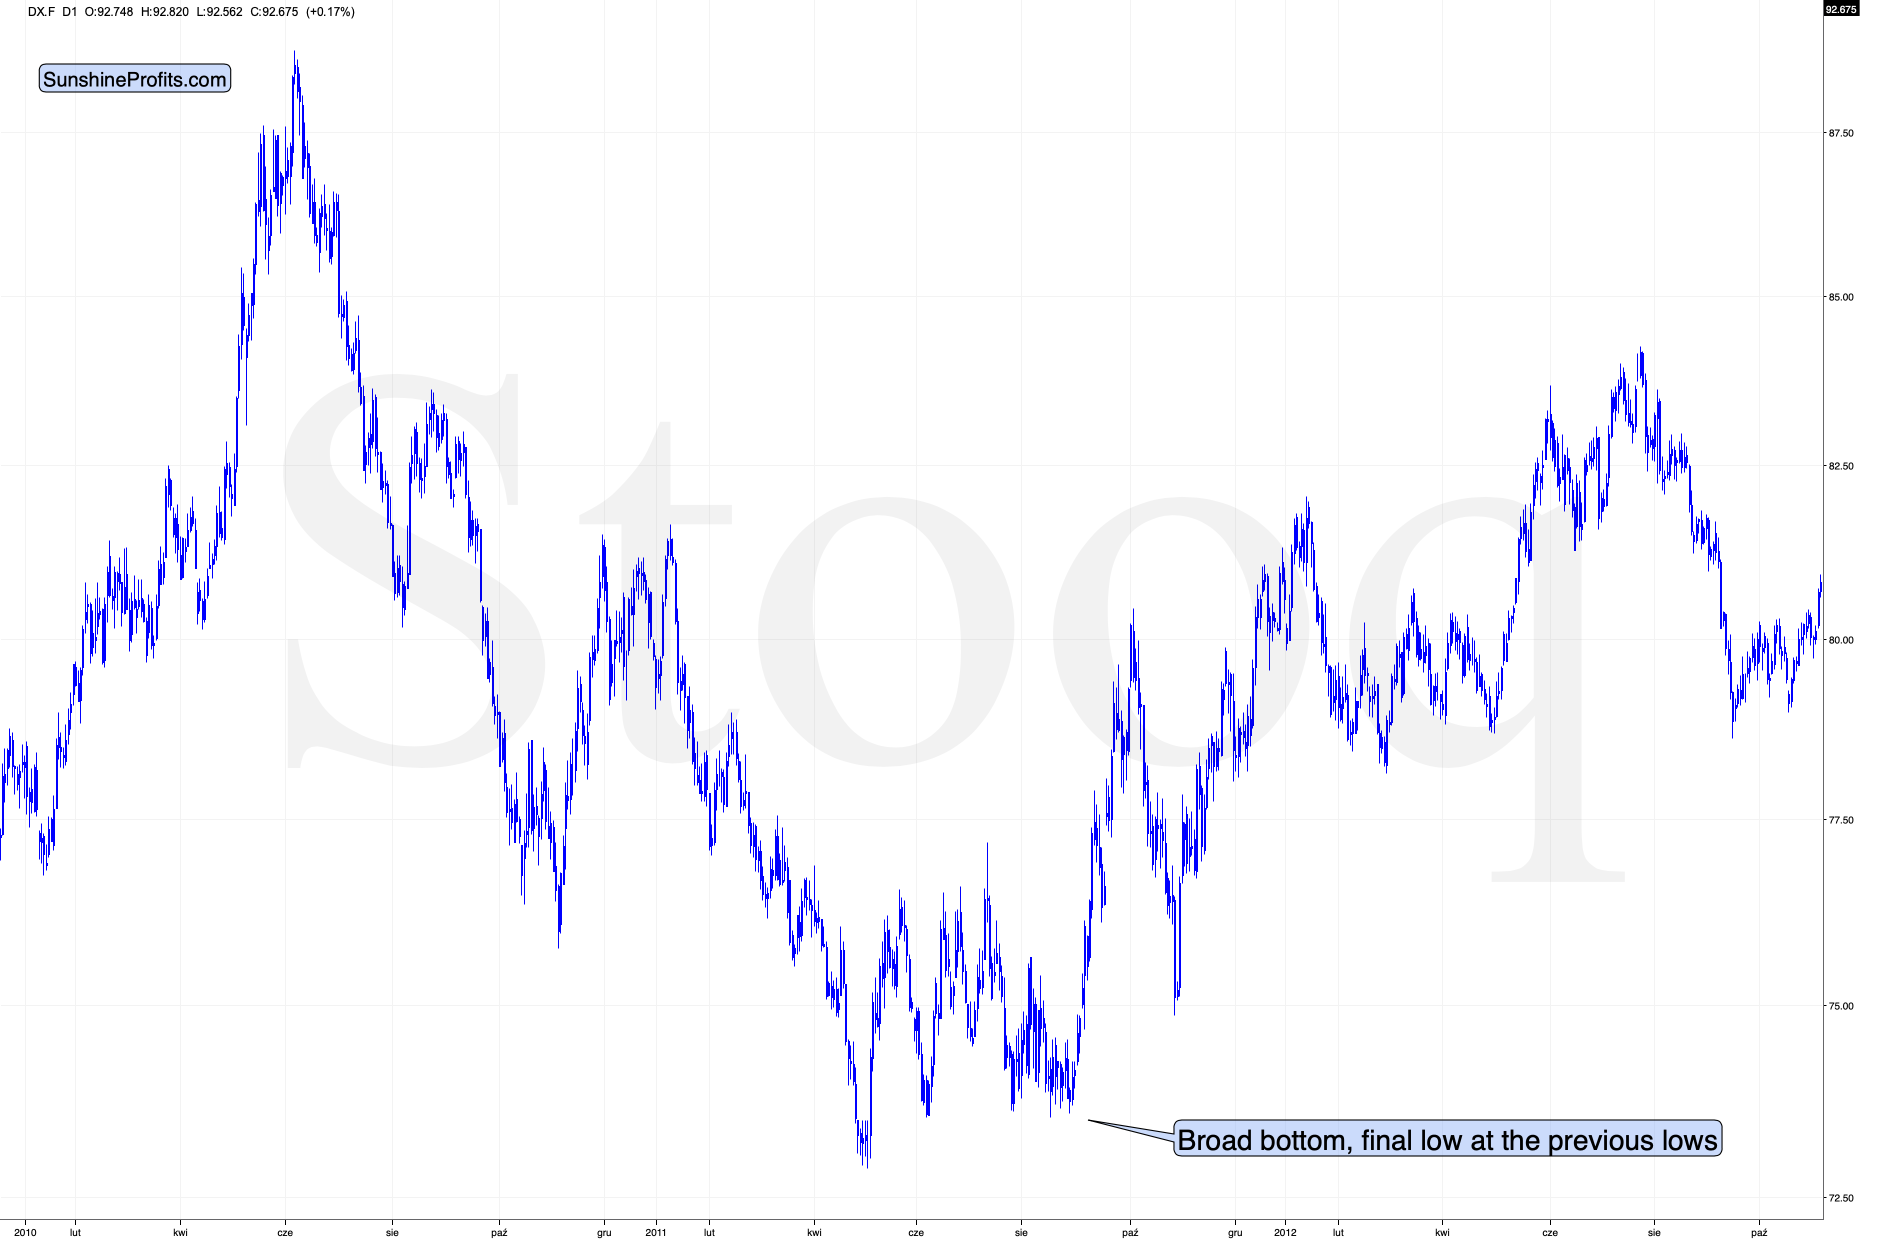
The bottoming pattern in 2011 is also very similar to what we see right now and what we saw earlier this year. The final bottom even took place at the previous lows – just like what we saw yesterday. This analogy is particularly important because August 2011 is when gold formed its multi-year high.
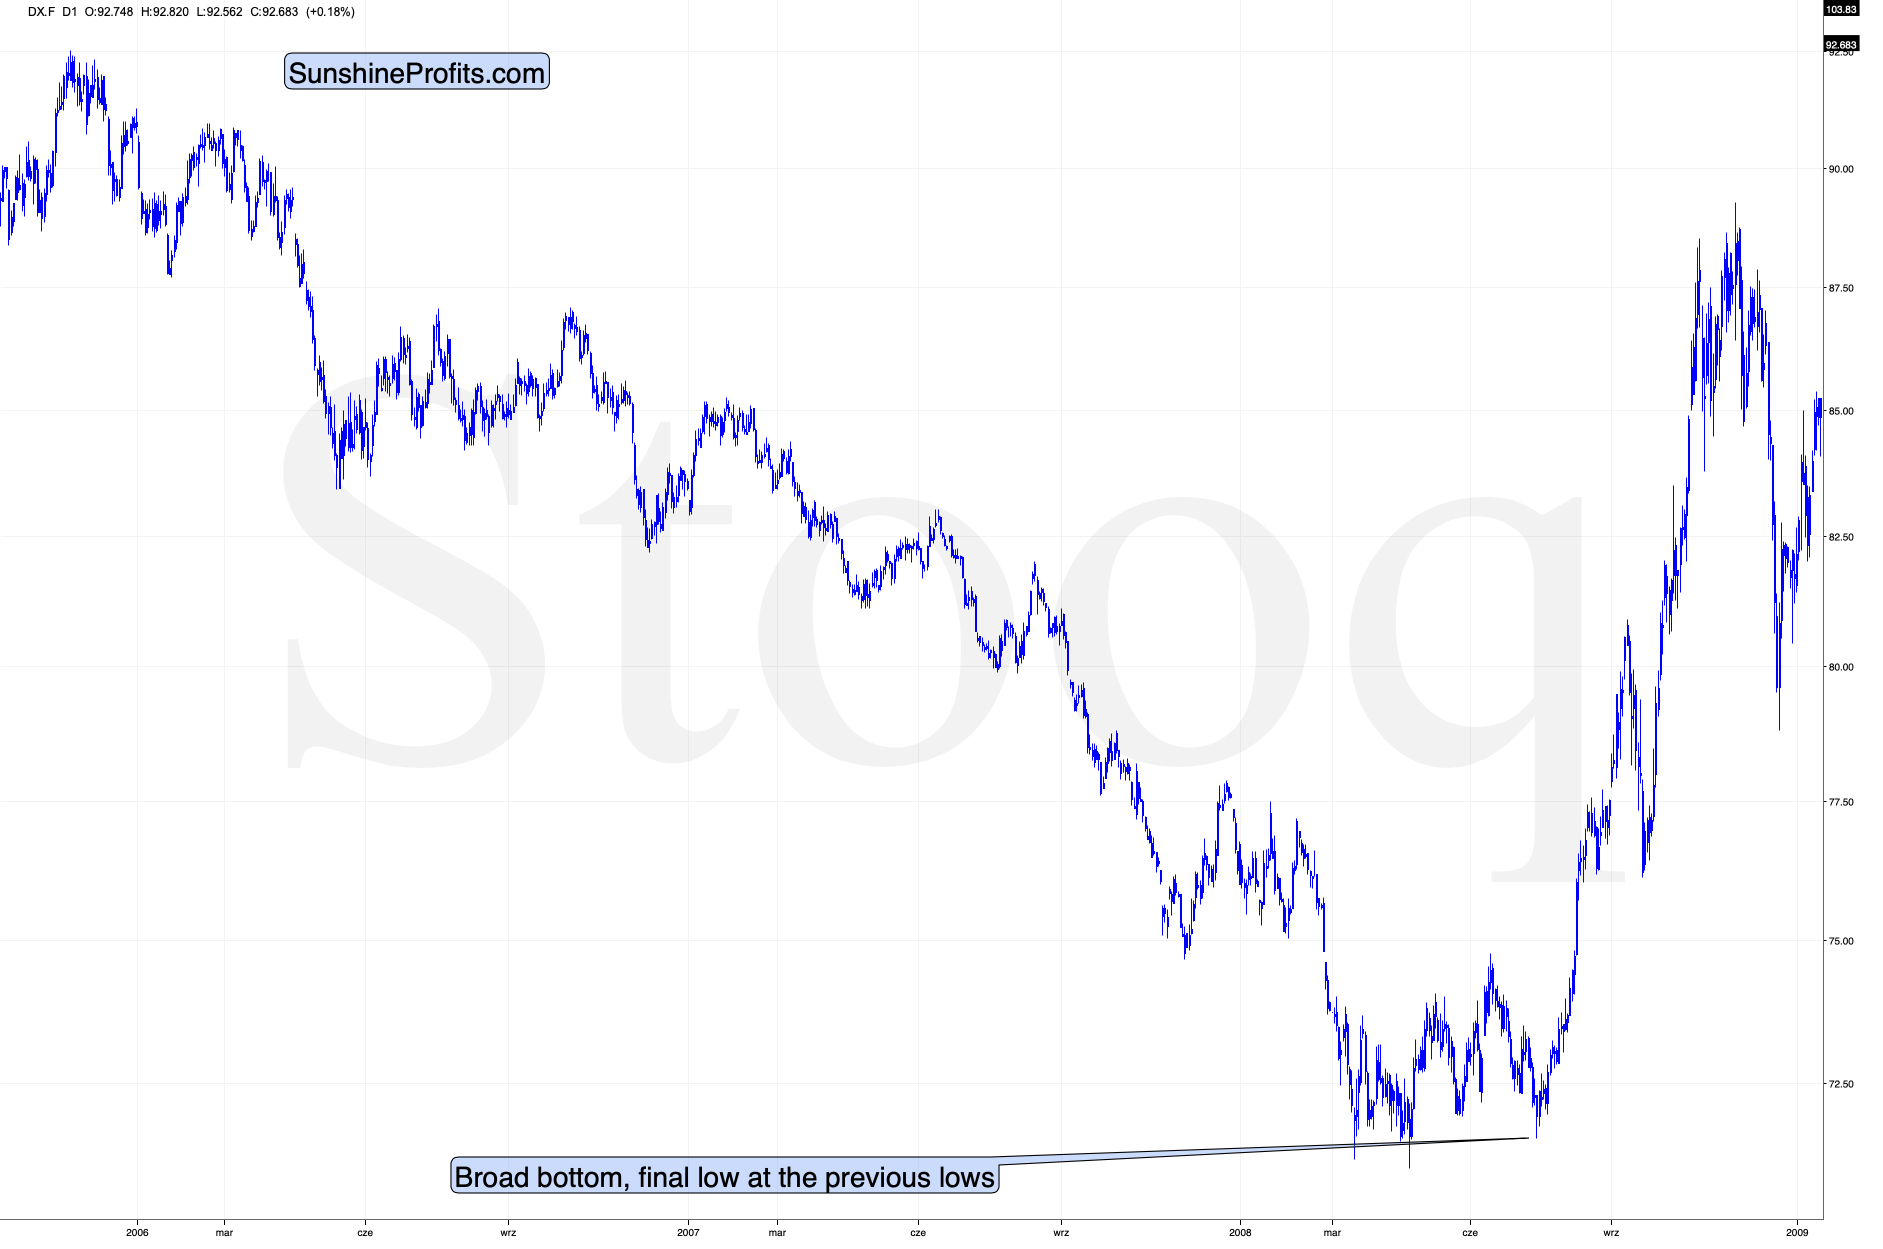
Back in 2008, the USD Index bottomed in a very similar manner. And yes, the final bottom formed close to the previous lows – once again just like what we saw this week.
So, does the invalidation of the short-term breakout in the USD Index really make the outlook bearish right now? In light of the above powerful analogies to the past major bottoms – absolutely not.
And as the USD Index soars, gold is likely to slide.
Additionally, let’s keep in mind that the short-term strength in the USD Index is likely to translate into an invalidation of the small breakdown below the rising support line that we see on USDX’s long-term chart.
My previous comments on that matter remain up-to-date (with the slight change that at the moment USDX is a bit below the support line, but let’s keep in mind that similar small breakdowns were invalidated shortly).
Remember when in early 2018 we wrote that the USD Index was bottoming due to a very powerful combination of support levels? Practically nobody wanted to read that as everyone “knew” that the USD Index is going to fall below 80. We were notified that people were hating on us in some blog comments for disclosing our opinion - that the USD Index was bottoming, and gold was topping. People were very unhappy with us writing that day after day, even though the USD Index refused to soar, and gold was not declining.
Well, it’s exactly the same right now.
The USD Index was at a powerful combination of support levels. One of them is the rising, long-term, black support line based on the 2011 and 2014 bottoms. The other major support level and a long-term factor is the proximity to the 92 level – that’s when gold topped in 2004, 2005, and where it – approximately – bottomed in 2015, and 2016.
The USDX just moved to these profound support levels, broke slightly below them, and now it has clearly invalidated this breakdown. For many weeks, we’ve been warning about the likely USD Index rally, and we finally saw it.
Quoting my previous comments:
USD Index moved briefly below the long-term, black support line and then it invalidated this breakdown before the end of the week. This is a very bullish indication for the next few weeks.
Before moving to the short-term chart, please note that the major bottoms in the USD Index that formed in the middle of the previous years, often took form of broad bottoms.
Consequently, the current back and forth trading is not that surprising. This includes the 2008, 2011, and 2018 bottoms.
A crucial aspect is that the rally that we’ve witnessed so far is just the tip of the bullish iceberg. The breakdown below the key support levels was invalidated, which is a strong bullish indicator. Since it happened on a long-term chart and the temporarily broken lines were critical, the implications are incredibly important as well– and they should be visible from the long-term perspective.
So, how high could the USD Index rally now? At least to the 100 level (approximately). This way, the upcoming rally would almost match the rally that started after the previous major invalidation – the 2018 one.
Still, we wouldn’t rule out a scenario in which the USD Index rallies above its 2020 highs before another major top. After all, the USD Index is after a very long-term breakout that was already verified several times.
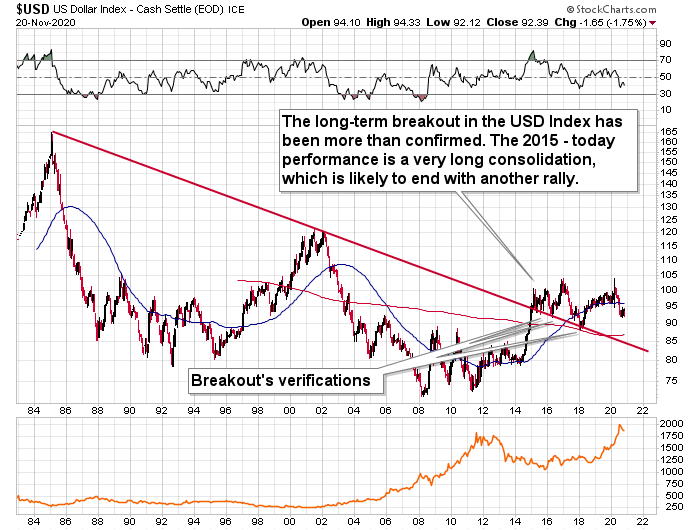
Taking into account USDX’s lengthy breakout, its several breakout verifications, and the 5-year consolidation, it seems that the USD Index is ready to rally much higher – perhaps to approximately to the 120 level.
Please note that the consolidation that preceded the previous rally to 120 that took place between 1997 and 2000 happened when the USD index was trading at relatively similar price levels – approximately between 90 and 105.
Overall, as the outlook remains bullish for the USD Index, it remains bearish for crude oil.
To summarize, for the upcoming weeks, the outlook for crude oil remains bearish. If crude oil is able to keep yesterday’s strength for longer, the above might change, but for the time being, the bearish outlook remains intact.
As always, we’ll keep you, our subscribers well informed.
Trading position (short-term; our opinion; levels for crude oil’s continuous futures contract): Full (100% of the regular position size) speculative short positions in crude oil are justified from the risk to reward point of view stop loss $45.63 at and $30.22 as the initial target price.
In the future contracts that are more distant than the current contract, we think adding the premium (the difference between the July and other contracts) to both: stop-loss and initial target prices is justified.
Thank you.
Przemyslaw Radomski, CFA
Editor-in-chief

