

Trading position (short-term; our opinion; levels for crude oil’s continuous futures contract): Short positions with $55.62 as a stop-loss and $28.12 as the initial price target
What now? For starters, some cold weather is hitting parts of the U.S., and there is an obvious demand for heating. Nothing out of the ordinary and
crude oil moved higher yesterday and in today’s pre-market trading due largely to this very news. Is this a game-changer? Let’s look deeper by jumping right into crude oil’s chart.
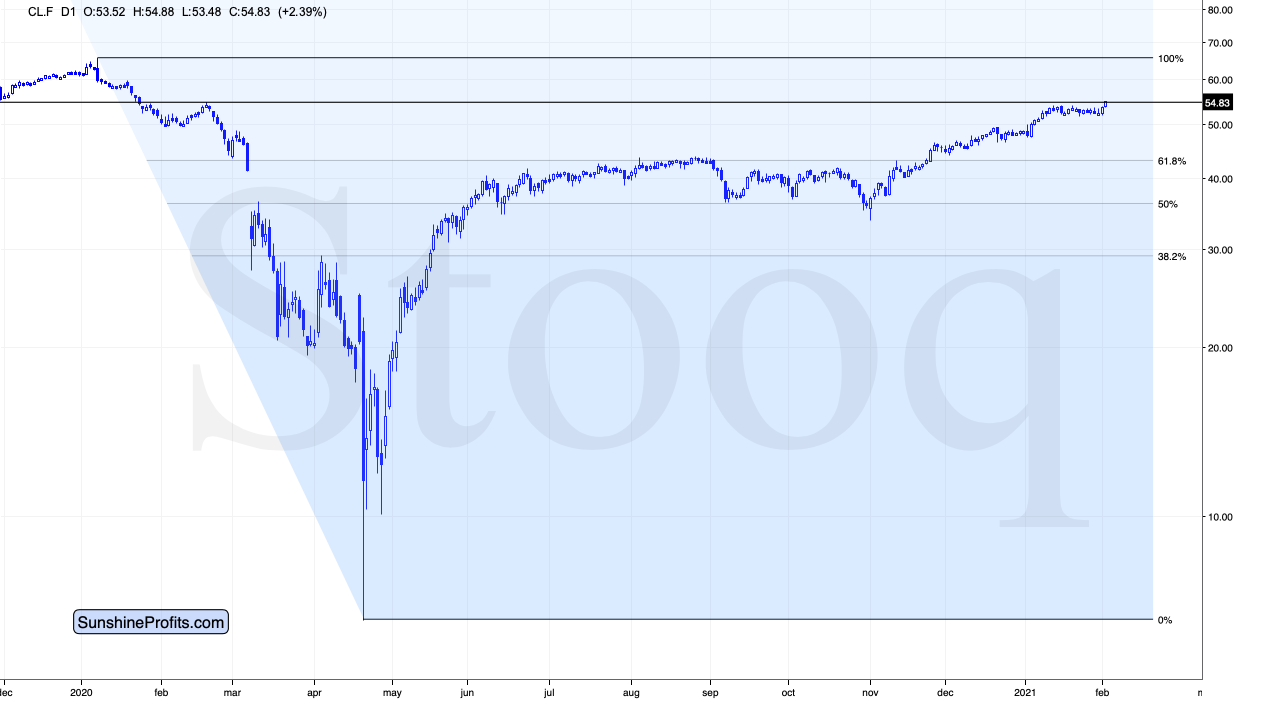
Figure 1 – Crude Oil-WTI
In short, that’s not the case. At the moment of writing these words, crude oil moved to its February high ($54.88) and it’s testing how strong this resistance really is.
That’s the most significant resistance that crude oil encountered since breaking above the August 2020 highs, so it seems quite likely that this level will keep the rally in check.
If it doesn’t, then the black gold will move further and touch our stop-loss level for this trade. In this case, our positions will automatically be closed. For now, the position remains open, as it’s likely that crude oil will reverse soon.
The above is in tune with what happened on the stock market and what happened in the USD Index. The former broke below its rising medium-term support line, while the latter appears to be breaking higher. Crude oil tends to decline when stocks decline and when the USD Index soars. That’s not a link carved in stone, but it’s quite reliable, anyway.
The USD Index just moved to a new yearly high.
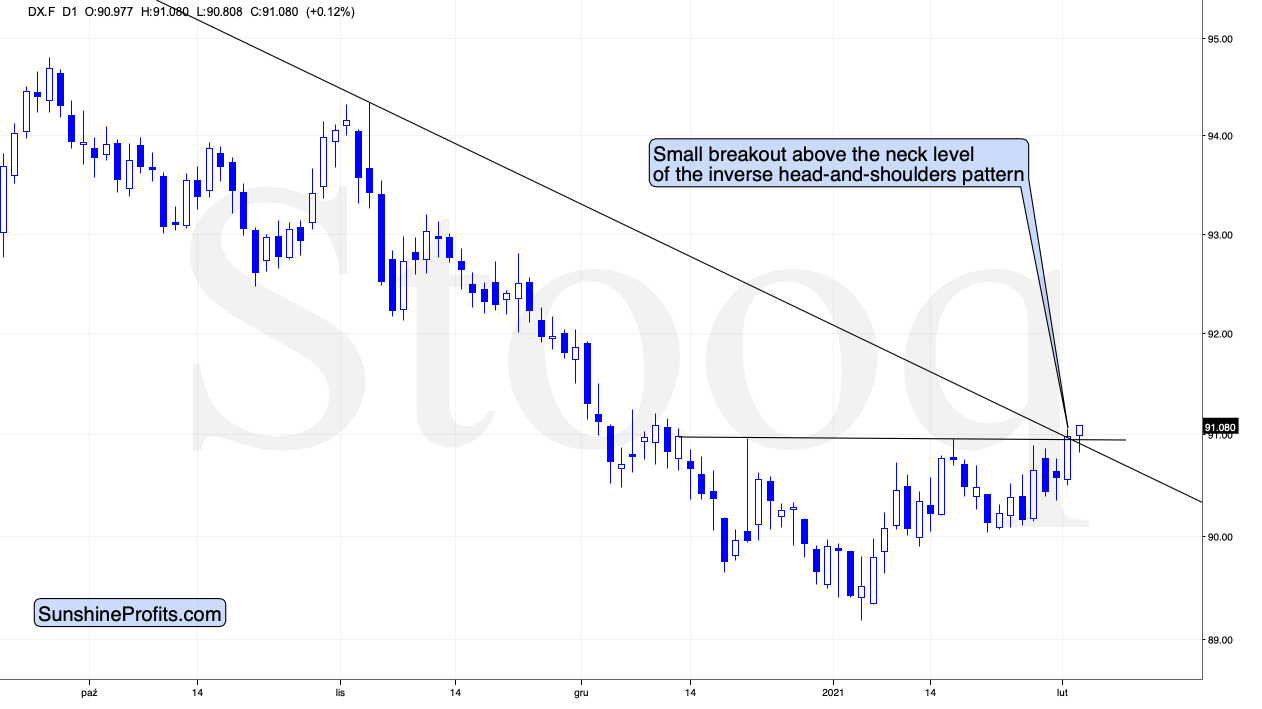
Figure 2 - USD Index
The move to new yearly high is not that important as the move above the neck level of the inverse head-and-shoulders pattern. This breakout is not yet confirmed, but once it is confirmed, it’s likely to trigger another powerful upswing.
Additionally, another short-term rally here will mean a decisive move above the medium-term declining resistance line and USD’s 50-day moving average. Please take a look at the chart below for details.
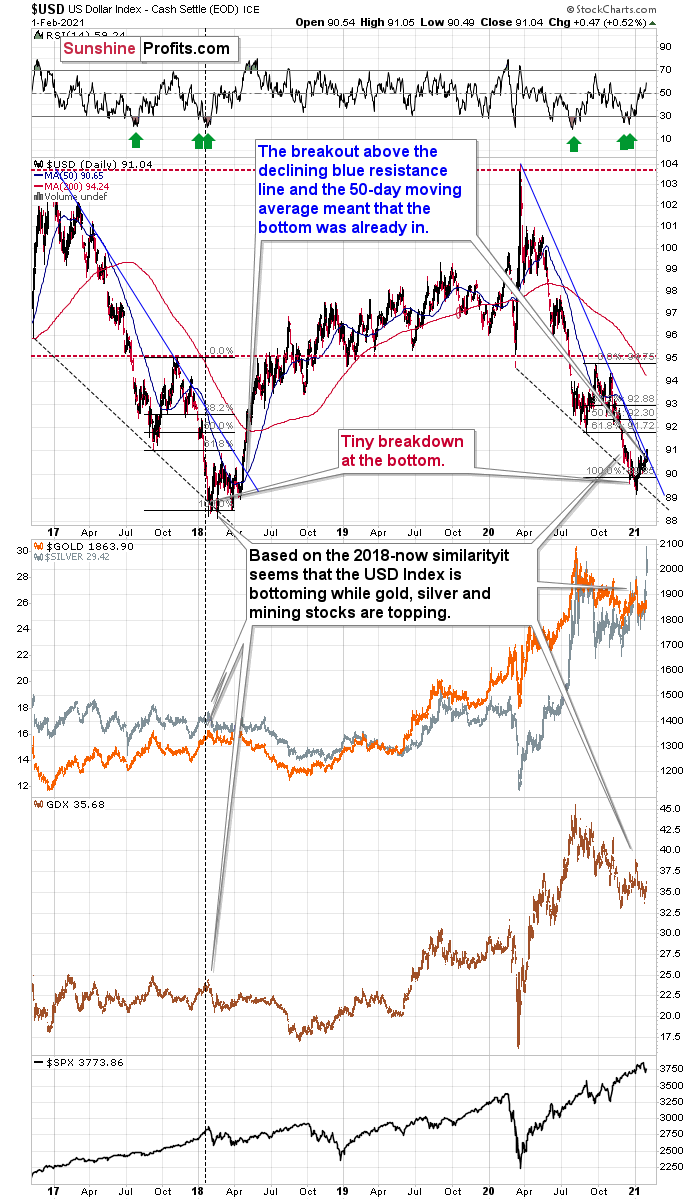
Figure 3
Yesterday’s (Feb. 1) close of 91.04 was above both: the declining blue resistance line and the 50-day moving average (90.65).
When we saw this kind of double breakout back in 2018, it meant that the bottoming process was complete and that one should buckle up for a sharp upswing. The implications are very bullish for the USD Index and they are likely to become bearish for crude oil either immediately or relatively soon.
To summarize, it’s likely that crude oil will decline soon, but even if it doesn’t and it moves higher in the near term, it’s likely to reverse and decline in the following weeks/months, anyway.
As always, we’ll keep you, our subscribers well informed.
Trading position (short-term; our opinion; levels for crude oil’s continuous futures contract): Short positions have become justified from the risk to reward point of view, as crude oil futures moved below $52.97. In this case, we view a short position with $55.62 as a stop-loss and $28.12 as the initial price target.
Thank you.
Przemyslaw Radomski, CFA
Founder, Editor-in-chief

