

Trading position (short-term; our opinion): Small (half of the regular size) short positions (with a stop-loss order at $61.13 and the initial downside target at $52) are justified from the risk/reward perspective.
On Monday, black gold moved lower after the market’s open as oil investors reacted to Friday’s Baker Hughes report. As a result, light crude came back to the trend channel, invalidating the earlier breakout above the upper border of the formation. What are the implications of this decline?
Crude Oil’s Technical Picture
Before we answer this question, let’s examine the technical picture of crude oil (charts courtesy of http://stockcharts.com).
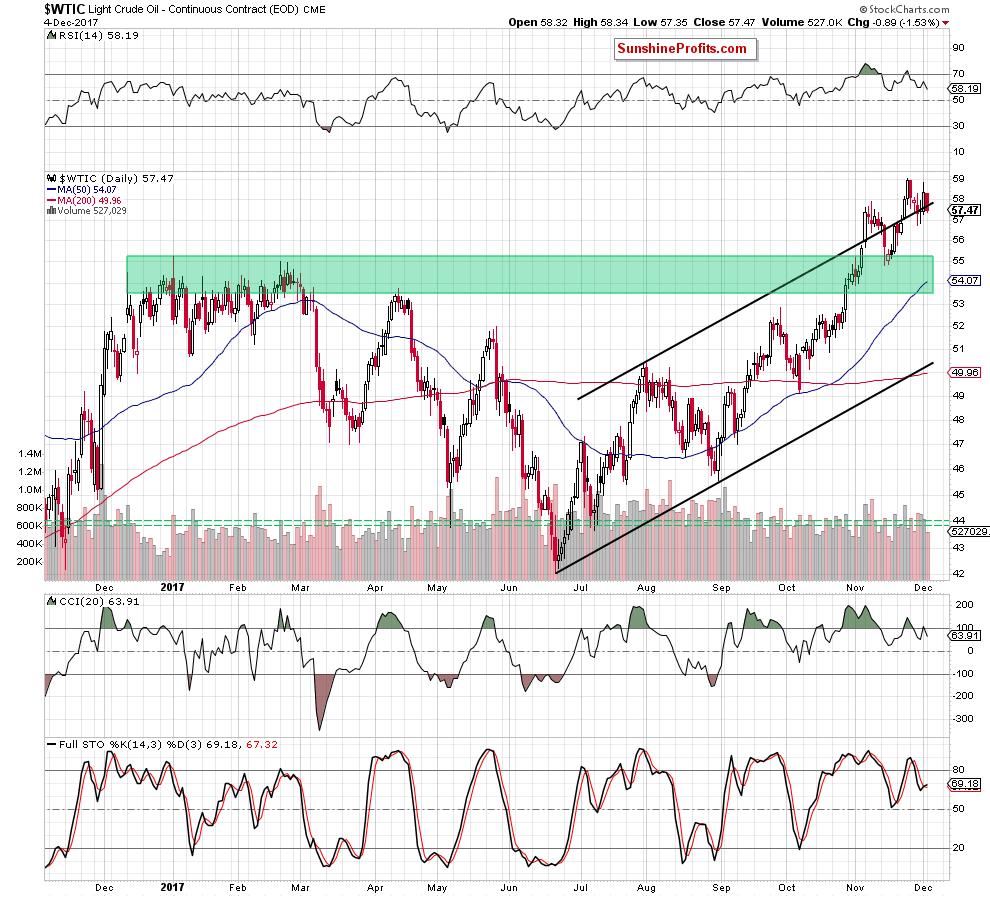
The first thing that catches the eye on the daily chart is the above-mentioned comeback to the black rising trend channel. Thanks to yesterday’s drop, the commodity invalidated the earlier breakout above the upper line of the formation, which doesn’t bode well for oil bulls and higher prices of black gold.
Additionally, the CCI re-generated the sell signal, while the Stochastic Oscillator is very close to doing the same (as a reminder, the sell signal generated by the RSI remains in cards), which increases the probability of another attempt to move lower – especially when we factor in what we wrote in our yesterday’s Oil Trading Alert:
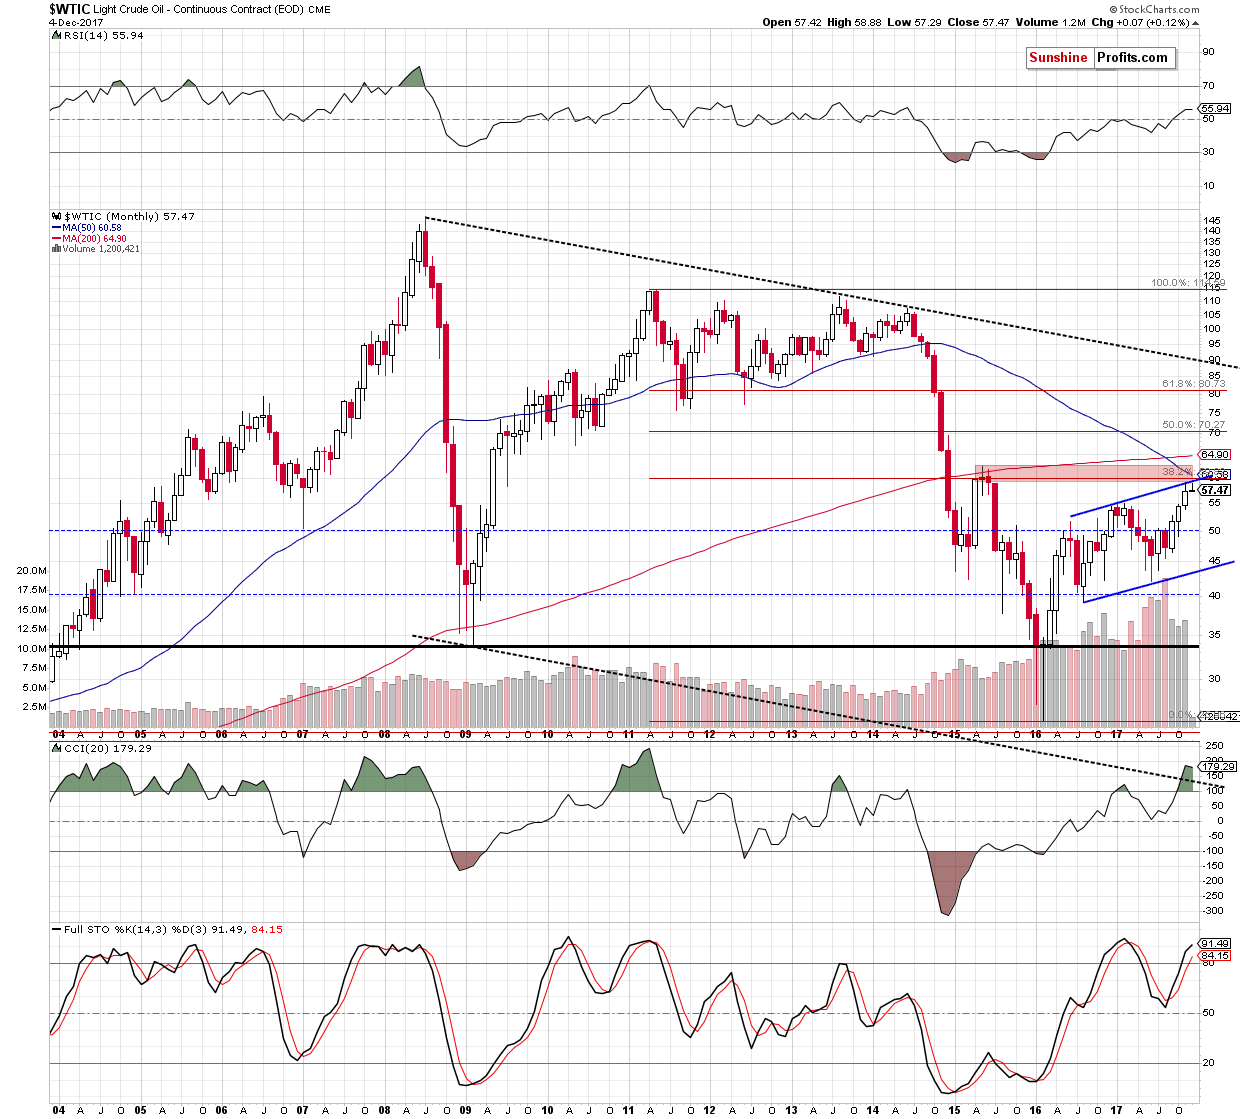
Looking at the long-term chart of the commodity, we see that crude oil moved higher on Friday, which resulted in a re-test of the strength of the upper border of the blue rising trend channel. As you see, this important resistance withstood the buying pressure and in combination with the red, major resistance zone triggered a pullback.
What does it mean for light crude? As you know from our last week’s alerts, we believe that as long as there is no breakout above the above-mentioned key resistance area another bigger move to the upside is not likely to be seen and lower prices of black gold are still ahead of us (even if we have to show some patience first).
Having said that, let’s check what can what can we infer from the medium-term chart.
From this perspective, we see that the RSI climbed above the level of 70 only 3 times since almost 10 years. Such high reading of the indicator preceded the 2008 crude oil all time high and the May 2011 peak. In both these cases, we saw sizable declines in the following weeks, which suggests that history may repeat itself once again in the very near future – especially when we factor in the proximity to the major resistance zone marked on the long-term chart.
What’s interesting, we noticed one more negative situation on the non-USD (WTIC:UDN ratio) chart of crude oil. As a reminder, UDN is the symbol for the PowerShares DB US Dollar Index Bearish Fund, which moves in the exact opposite direction to the USD Index. Since the USD Index is a weighted average of the dollar's exchange rates with world's most important currencies, the WTIC:UDN ratio displays the value of crude oil priced in "other currencies".
Crude Oil from Non-USD Perspective
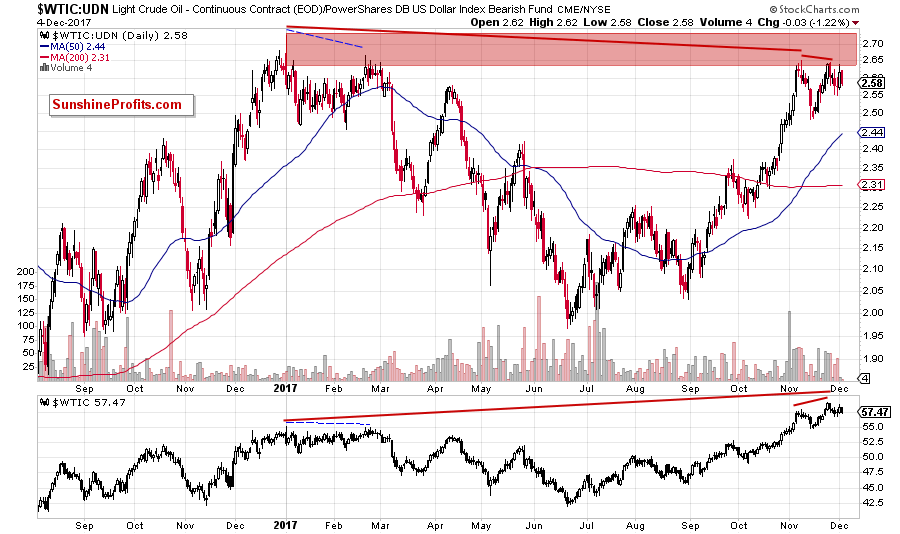
On the short-term chart, we noticed three negative divergences between the ratio and the price of crude oil priced in the U.S. dollars in 2017.
In many of our trading alerts you could read about the divergence between some indicator /indicators and the price of crude oil. The negative divergence (or the bear divergence) warns that the upward trend may end soon and appears when the price of the commodity rises to the new maximum, but the indicator hits its peak at a lower level than during the previous increase. Such situation is often considered as a sell signal and usually precedes declines.
What does this have in common with the above-mentioned divergences between the price of crude oil and the level of ratio? When we use the ratio in the same way as we use indicators, we think that we can get interesting clues about crude oil future moves.
As you see on the above chart, although black gold climbed above the January peak and hit a fresh 2017 high in the previous month, we didn’t see such breakout on the non-USD chart. Interestingly, on November 24, the ratio didn’t break above the previous peak creating another negative divergence. When we take a closer look at the chart, we can notice a similar situation at the beginning of the year. In February, crude oil increased above $55 and almost created a double top pattern. What happened at the same time with the ratio? It also moved higher, but visibly lower (we marked these situations with the blue dashed lines), creating a negative divergence. What happened next? After several days in the consolidation, crude oil and the ratio declined together, erasing around 60% of the November 2016-January 2017 upward move.
Taking into account the long-, the medium-term pictures and the above similarity between the current situation and what we saw at the beginning of the year, we think that reversal and declines in both cases (crude oil and the ratio) are very likely.
How low could crude oil go if oil bears show their strength in the coming weeks? In our opinion, if light crude extends losses from current levels, we’ll see (at least) a drop to around $54.81-$55.24, where the January peak and the mid-November lows are. If this support area is broken, the way to lever levels will be open.
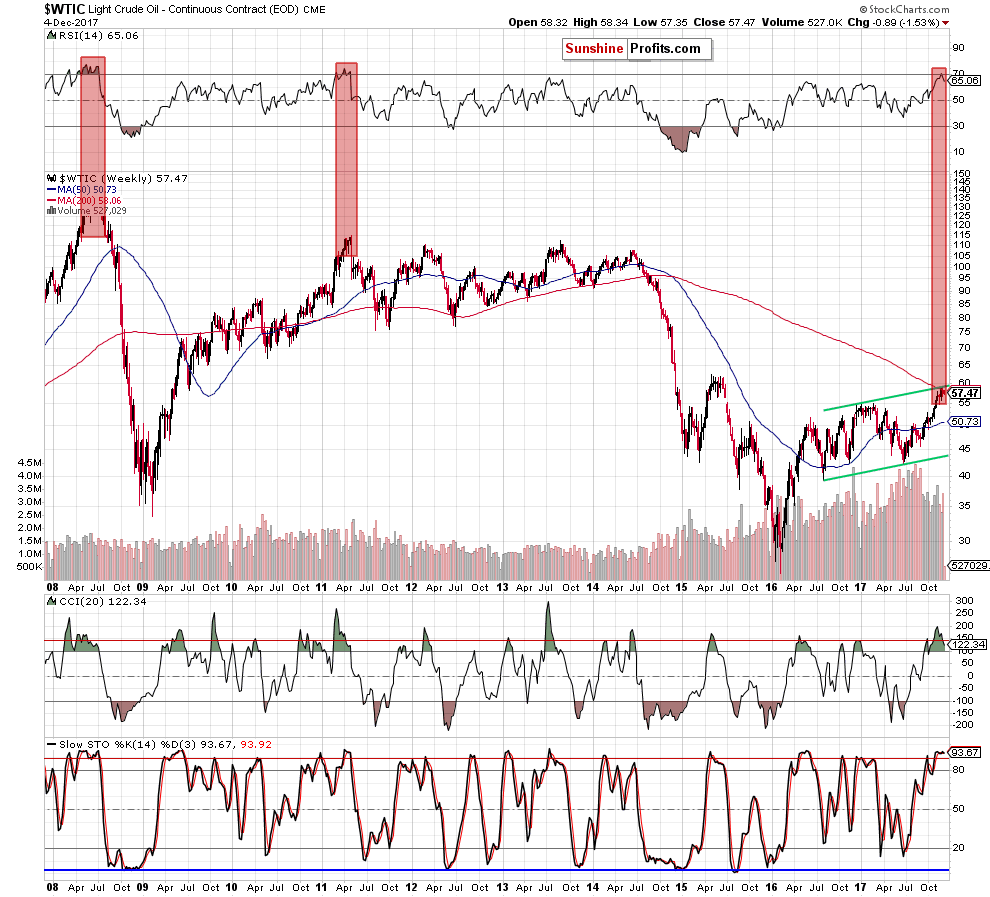
Finishing today’s alert, we would like to add that crude oil not only invalidated the earlier breakout above the upper border of the black rising trend channel, but also slipped under the 200-week moving average, which is an additional negative sign. Nevertheless, similarly to what we wrote in the previous week, this event will turn into bearish if we see a weekly closure under this moving average.
Summing up, short positions continue to be justified from the risk/reward perspective as crude oil invalidated the earlier breakout above the upper border of the black rising trend channel and slipped below the 200-week moving average. The pro-bearish scenario is also reinforced by the current situation in the WTIC:UDN ratio (negative divergences between the ratio and the price of crude oil priced in the U.S. dollars), which increases the probability of further declines in the coming week(s).
Very short-term outlook: bearish
Short-term outlook: bearish
MT outlook: mixed
LT outlook: mixed
Trading position (short-term; our opinion): Small (half of the regular size) short positions (with a stop-loss order at $61.13 and the initial downside target at $52) are justified from the risk/reward perspective. We will keep you – our subscribers – informed should anything change.
As a reminder – “initial target price” means exactly that – an “initial” one, it’s not a price level at which we suggest closing positions. If this becomes the case (like it did in the previous trade) we will refer to these levels as levels of exit orders (exactly as we’ve done previously). Stop-loss levels, however, are naturally not “initial”, but something that, in our opinion, might be entered as an order.
Thank you.
Nadia Simmons
Forex & Oil Trading Strategist
Przemyslaw Radomski, CFA
Founder, Editor-in-chief, Gold & Silver Fund Manager
Gold & Silver Trading Alerts
Forex Trading Alerts
Oil Investment Updates
Oil Trading Alerts

