

Trading position (short-term; our opinion): Small (half of the regular size) short positions (with a stop-loss order at $61.13 and the initial downside target at $52) are justified from the risk/reward perspective.
On Thursday, crude oil moved higher and broke above the upper border of the trend channel, but can we trust this increase?
Crude Oil’s Technical Picture
Let’s examine the technical picture of crude oil (charts courtesy of http://stockcharts.com).
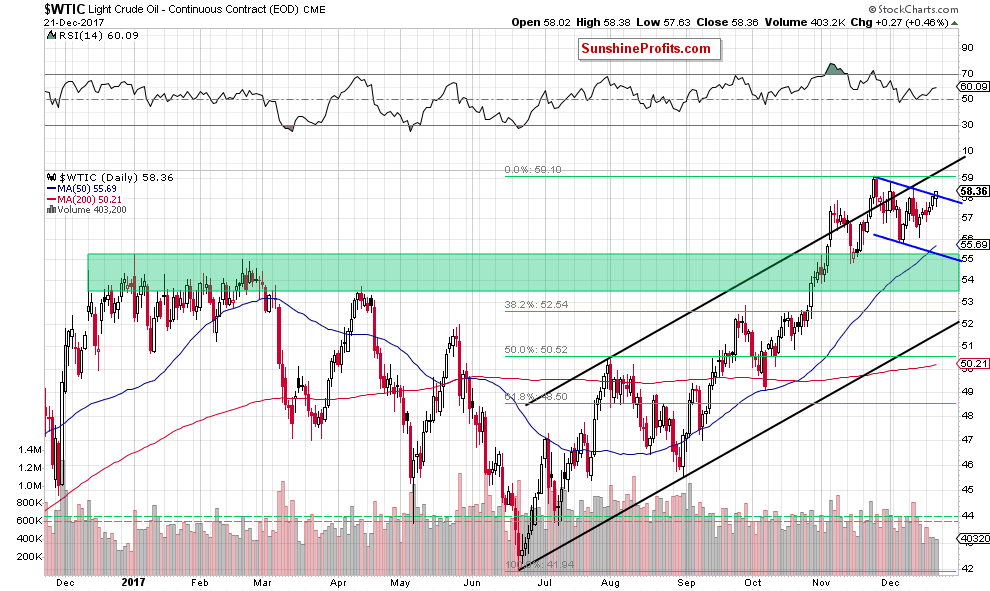
The first thing that catches the eye on the daily chart is the breakout above the upper border of the very short-term blue declining trend channel. Although this is a positive event, we have some doubts about further improvement.
Why?
When we take a closer look at the above chart, we see that the size of volume, which accompanied yesterday’s increase was smaller than what we saw on Tuesday and Wednesday. Such situation raises doubts about oil bulls’ strength and further rally – especially when we compare it to the size of volume during declines.
Additionally, just like we wrote yesterday, the space for gains is limited as the recent highs, the upper border of the black rising trend channel, the medium- and long-term resistances are very close.
Let’s take a closer look at the weekly chart below and recall the yesterday's alert
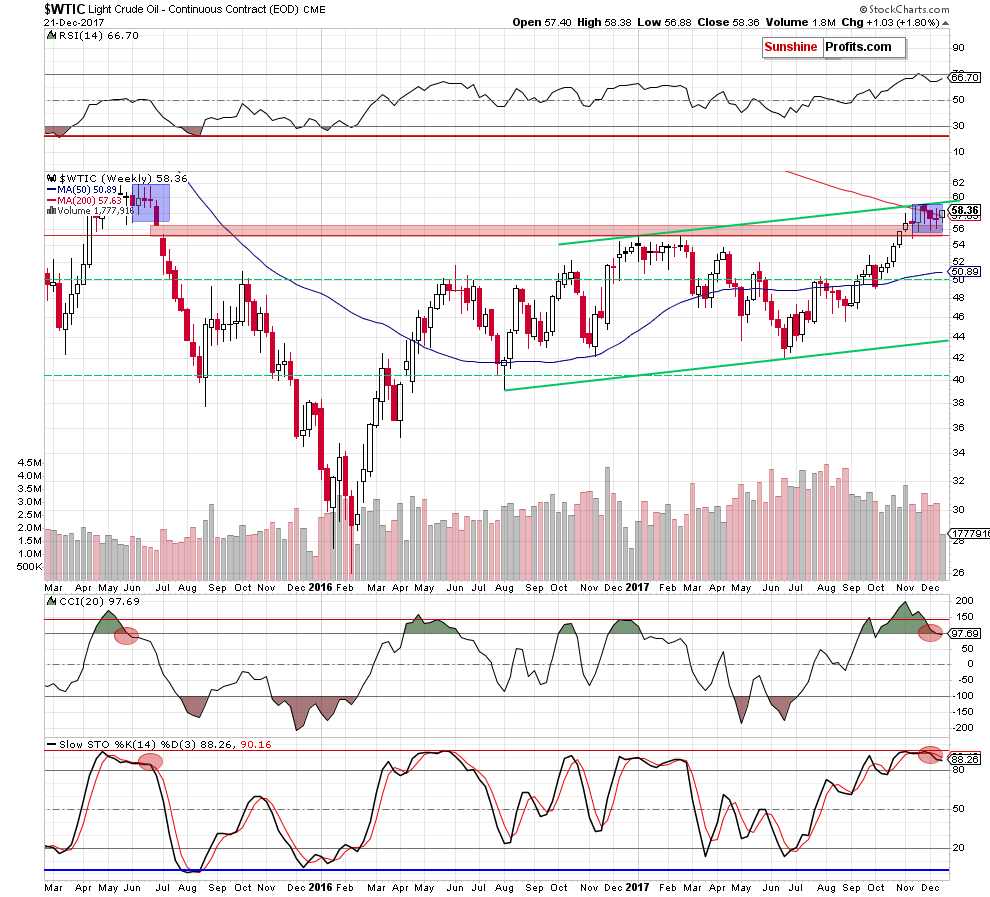
From the broader perspective, we clearly see that (…) although light crude came back above the 200-week moving average, it’s not a bullish development anymore, because we saw similar price action several times in the previous weeks and none of these invalidations brought significant growth.
Additionally, the sell signals generated by the medium-term indicators remain in cards, suggesting lower prices of black gold in the coming weeks. On top of that, the upper border of the blue consolidation, the upper line of the rising trend channel, the 50-month moving average and the red resistance zone seen on the monthly chart below continue to block the way to higher levels.
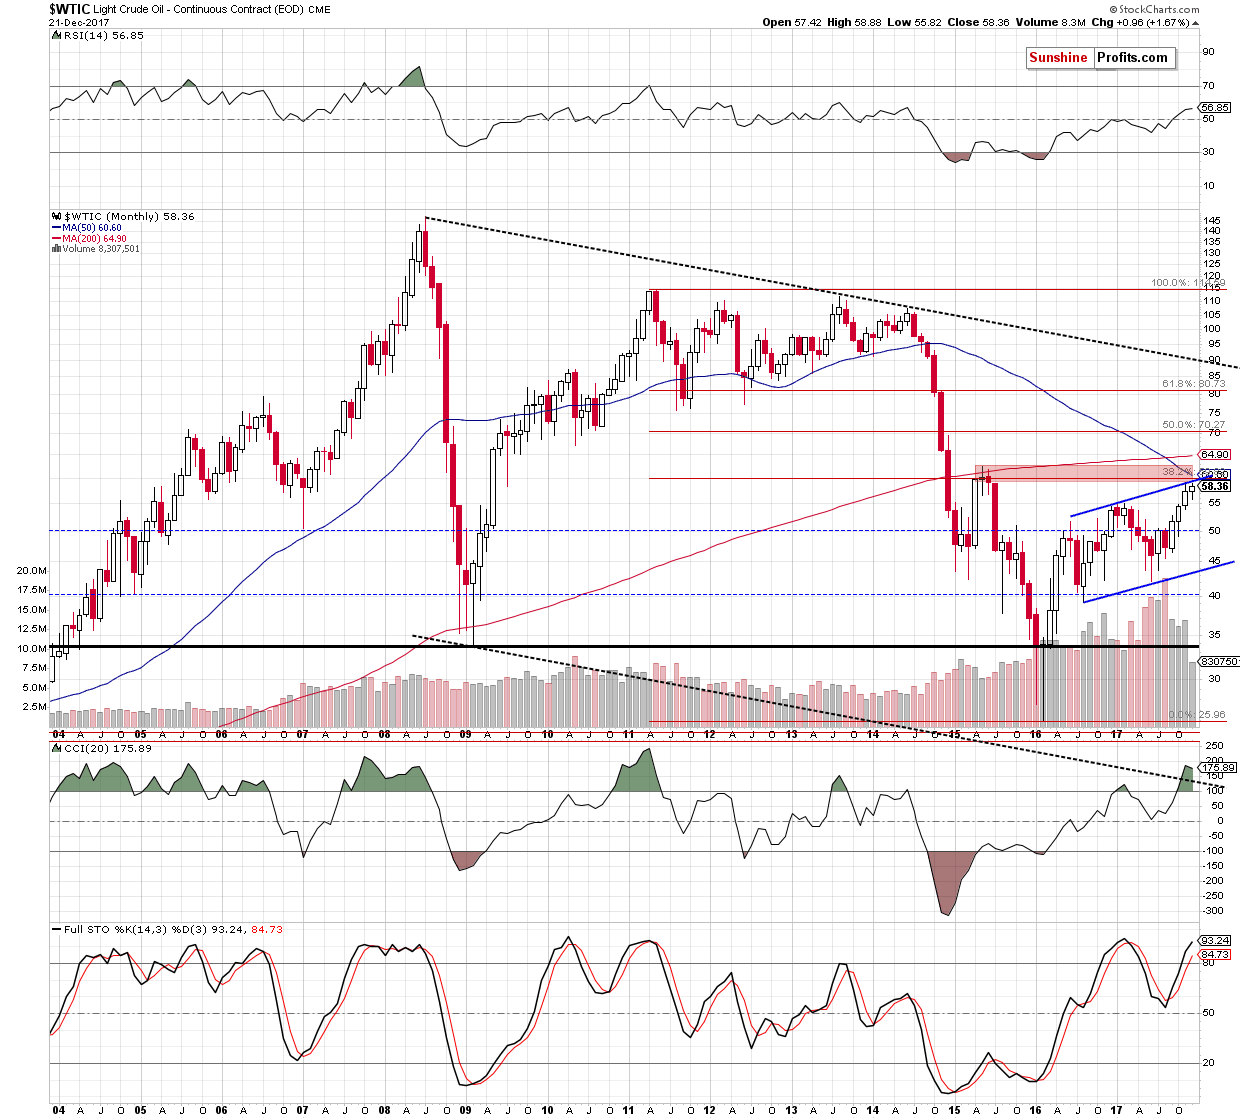
What does all the above mean for crude oil and the bulls? In our opinion, as long as there is in breakout above this key resistance zone, the way to higher prices is closed. In other words, a reversal and bigger move to the downside is just around the corner.
Summing up, short positions continue to be justified from the risk/reward perspective as crude oil remains under the upper line of the black rising trend channel and the key resistance zone marked on the monthly chart. Additionally, the sell signals generated by the weekly indicators together with the bearish fundamental factors increase the probability of declines in the coming week(s).
Very short-term outlook: bearish
Short-term outlook: mixed with bearish bias
MT outlook: mixed
LT outlook: mixed
Trading position (short-term; our opinion): Small (half of the regular size) short positions (with a stop-loss order at $61.13 and the initial downside target at $52) are justified from the risk/reward perspective. We will keep you – our subscribers – informed should anything change.
On an administrative note, due to travel plans, there will be no Oil Trading Alerts on Tuesday, December 26, 2017 and on Tuesday, January 2, 2018. However, if something urgent happens, we will provide you with a quick alert anyway.
Thank you.
Nadia Simmons
Forex & Oil Trading Strategist
Przemyslaw Radomski, CFA
Founder, Editor-in-chief, Gold & Silver Fund Manager
Gold & Silver Trading Alerts
Forex Trading Alerts
Oil Investment Updates
Oil Trading Alerts

