

Trading position (short-term; our opinion): No position is justified from the risk/reward perspective.
First of all, thank you for your patience. It's been some time since I published my last Oil Trading Alert, and I'm happy to be providing you with this analysis once again. As you may know, my other service - Day Trading Signals - has become very popular (probably due to its profitability) and I decided to focus more of my time on it. Due to this reason, I stopped writing Forex Trading Alerts. However, the Oil Trading Alerts will continue, similarly to how we were providing them previously. In fact, we will be providing them very similarly to how we were providing them when they first launched.
Namely, I will be creating them along with Przemyslaw Radomski, CFA. I will be providing you with analytical details and based i.a. on them PR will be making decisions regarding trading positions. This way of providing Oil Trading Alerts has been working very well in the past, so it seems that it's a step in a good direction now as well. Having said that, let's move to crude oil's outlook.
Crude oil declined sharply in January and this month didn't provide any relief so far. Normally - at least that was the case in 2019 - crude oil should rebound from these levels, but... These times may not be like anything we saw in 2019. They might be more like what we saw in 2018, when crude oil declined relentlessly for a few months and its price was almost cut in half. Which analogy is more likely? It seems that crude oil's fate will be sealed in the upcoming days and weeks.
Let's take a closer look at the charts below (charts courtesy of http://stockcharts.com).
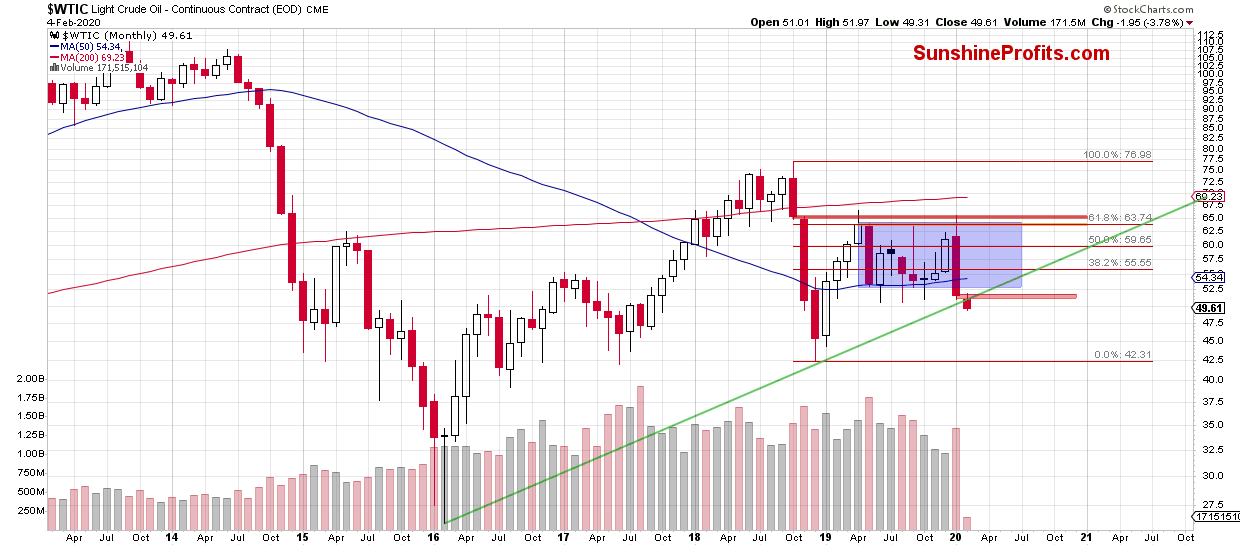
Indeed, from the long-term perspective, we see that January was very hard for oil bulls. The combination of two pro-bearish gaps and an invalidation of a tiny breakout above the upper border of the blue consolidation encouraged the sellers to act.
As a result, the commodity moved sharply lower in the following weeks, finishing the month under the lower border of the mentioned consolidation. When we take a closer look at the above chart, we clearly see that there were several attempts to move under this consolidation, but in all previous cases the bulls were strong enough to trigger a rebound.
This time they failed, and their only hope was the support area created by the previous lows (seen more clearly on the weekly chart below) and the very strong, green support line based on the 2016 and 2018 lows.
From today's point of view, we see that even these strong supports also were not strong enough to stop the bears. As you see, black gold started new month with a red pro-bearish gap, which was a warning signal for buyers. Why was it a warning sign? Because although they tried to close it at the beginning of February, their opponents took control very quickly, and pushed the price of the commodity lower. In fact, they pushed it so low, that it broke not only below the opening level, but also under the above-mentioned long-term green support line.
This price action added oil (pun not intended) to the fire, and black gold moved even lower earlier this week.
How this week's decline affected the shape of the weekly chart? Let's focus on the chart below to find out.
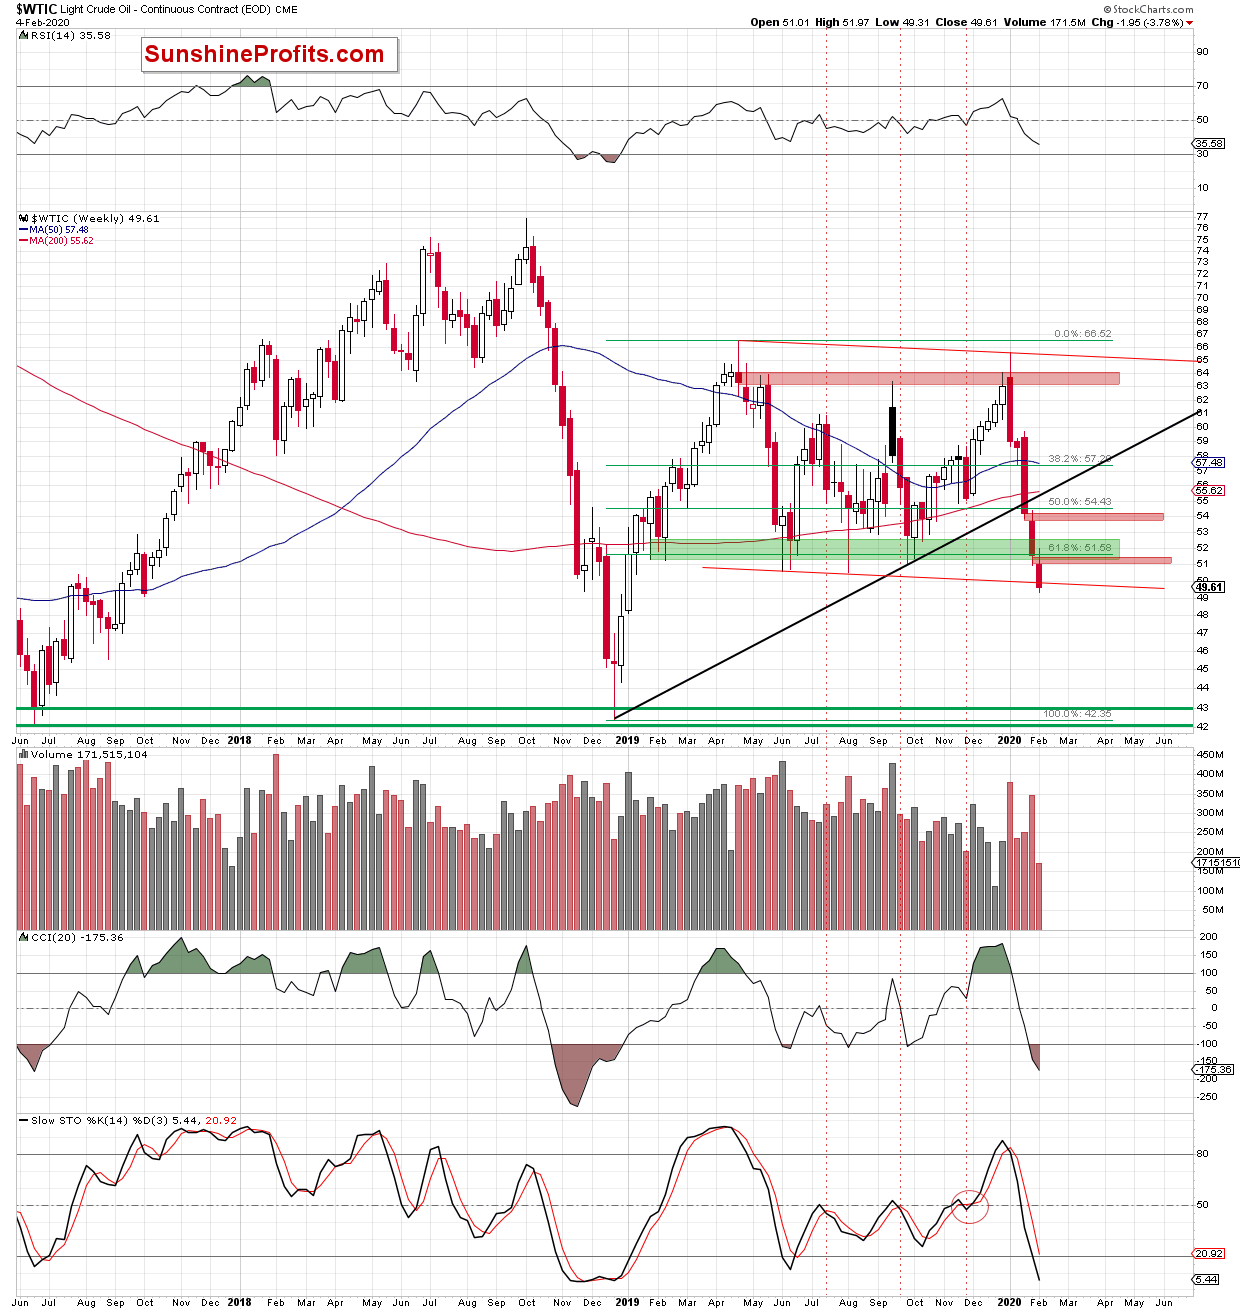
On the medium-term chart, we see that crude oil opened the last week of January with a pro-bearish red gap, which managed to stop the buyers in the following days. At this point it is also worth noting that week earlier the commodity moved sharply lower, breaking under the black support line based on the previous lows and the 50% Fibonacci retracement, which gave the sellers even more reasons to act.
As a result, crude oil reached the green support zone based on the previous lows and the 61.8% Fibonacci retracement, which could raise hope in many bulls for rebound from this area.
Pro-growth plans of the buyers were quite dramatically thwarted by their rivals when black gold opened this week with another red gap. What's even worse the opening took place below mentioned 61.8% Fibonacci retracement, which opened the way to lower levels.
Is there any hope for bulls on the horizon?
Thanks to this week's drop the price of light crude slipped to the lower border of the declining red trend channel, but the buyers didn't manage to hold it. This, together with the current position of the weekly indicators suggests that the decline may not be over yet.
Nevertheless, if the buyers manage to invalidate the mentioned breakdown, the chances for a bigger rebound (at least to the red gap created at the beginning of the week) will likely increase - especially when we factor in the current position of the daily indicators on the chart below.
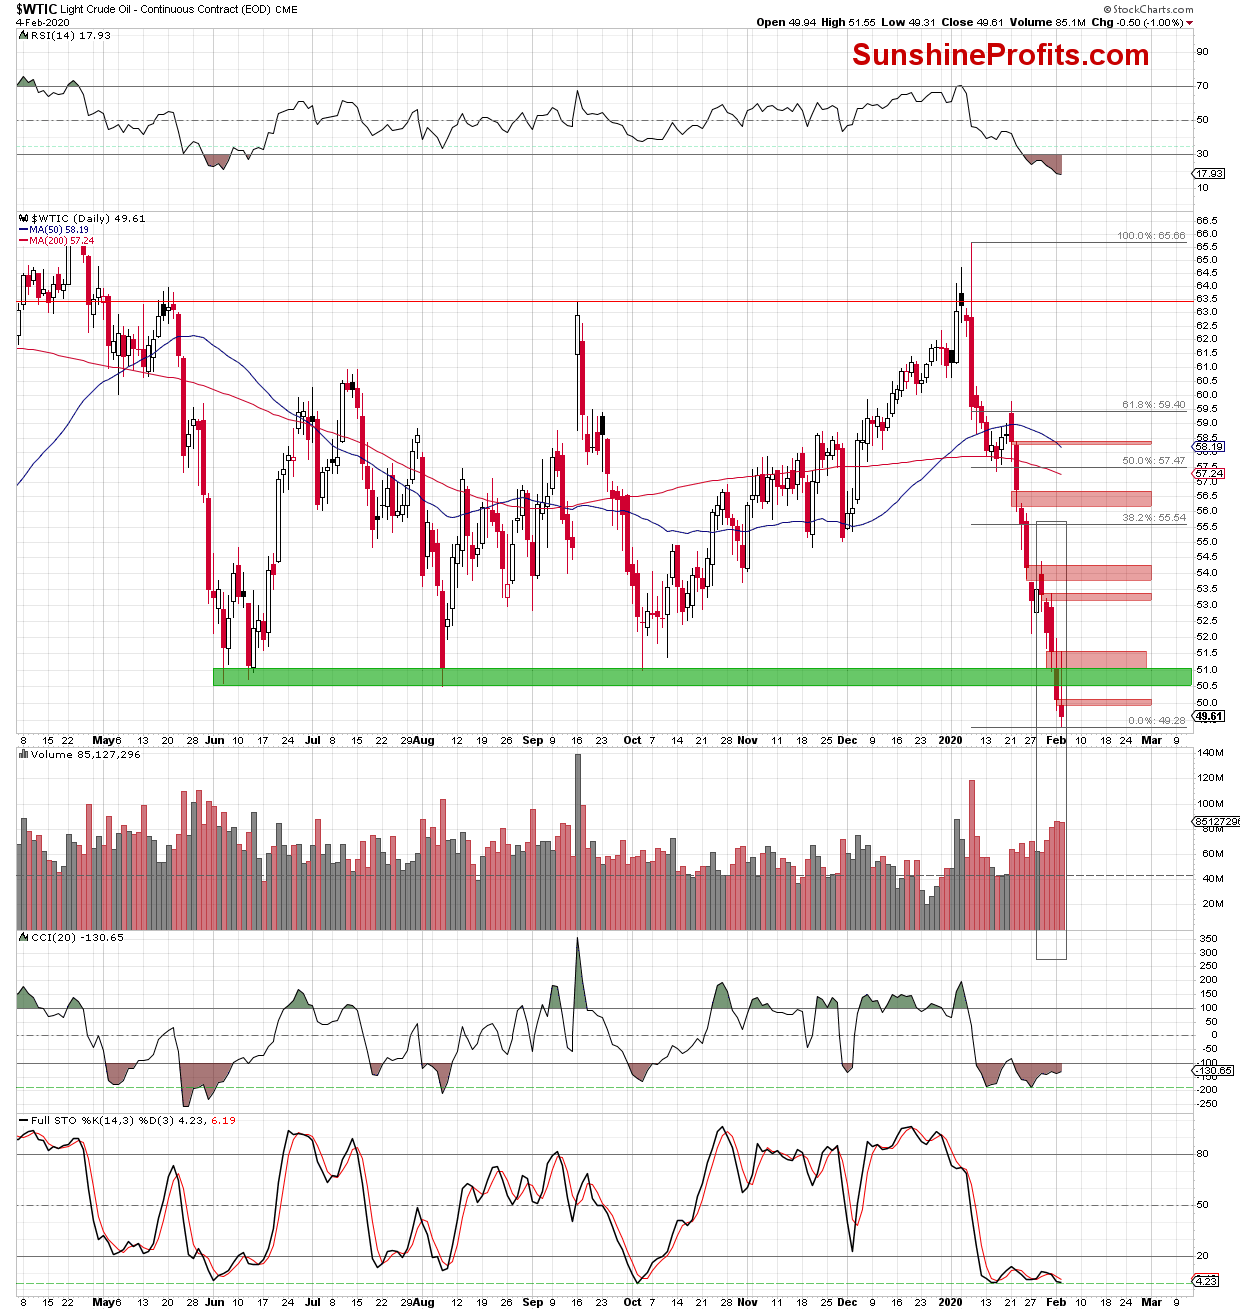
From the daily perspective, we can see that there are bullish divergences between the CCI, the Stochastic Oscillator and the commodity and the RSI slipped to its multi-month lows.
The Stochastic doesn't add clarity to the current picture despite being very oversold. Twice in 2019, something similar triggered a major rebound, but... We already saw Stochastic similarly oversold in mid-January and you know what happened next - bulls' carnage.
Is the combination of previously mentioned factors enough to stop the bears?
In our opinion, it's not - at least at the moment of writing these words. Here's why.
First, since January 21, 2020 crude oil created 6 pro-bearish red gaps. In none of the cases marked on the chart the bulls were strong enough to close even one gap. Yes, they tried several times - mainly since the end of the correction that took place at the end of last month (we marked this area with the grey rectangle), but all their attempts failed, revealing and emphasizing their weakness.
Second, the volume, which accompanied the recent declines were higher and higher from session to session, which only confirmed the strength of the sellers.
Third, on Monday, crude oil dropped under the green support zone based on the previous lows and closed the day below it, which translated only into another red gap. Yesterday, the buyers tried to close both of the gaps, but the failed once again, which suggests that could be nothing more than a verification of the earlier breakdown.
And speaking of the verification of the earlier breakdown... Earlier today, crude oil futures rebounded, and the bulls managed to close the gap created yesterday (the first point for the bulls). Let's take a closer look at today's pre-market price action.
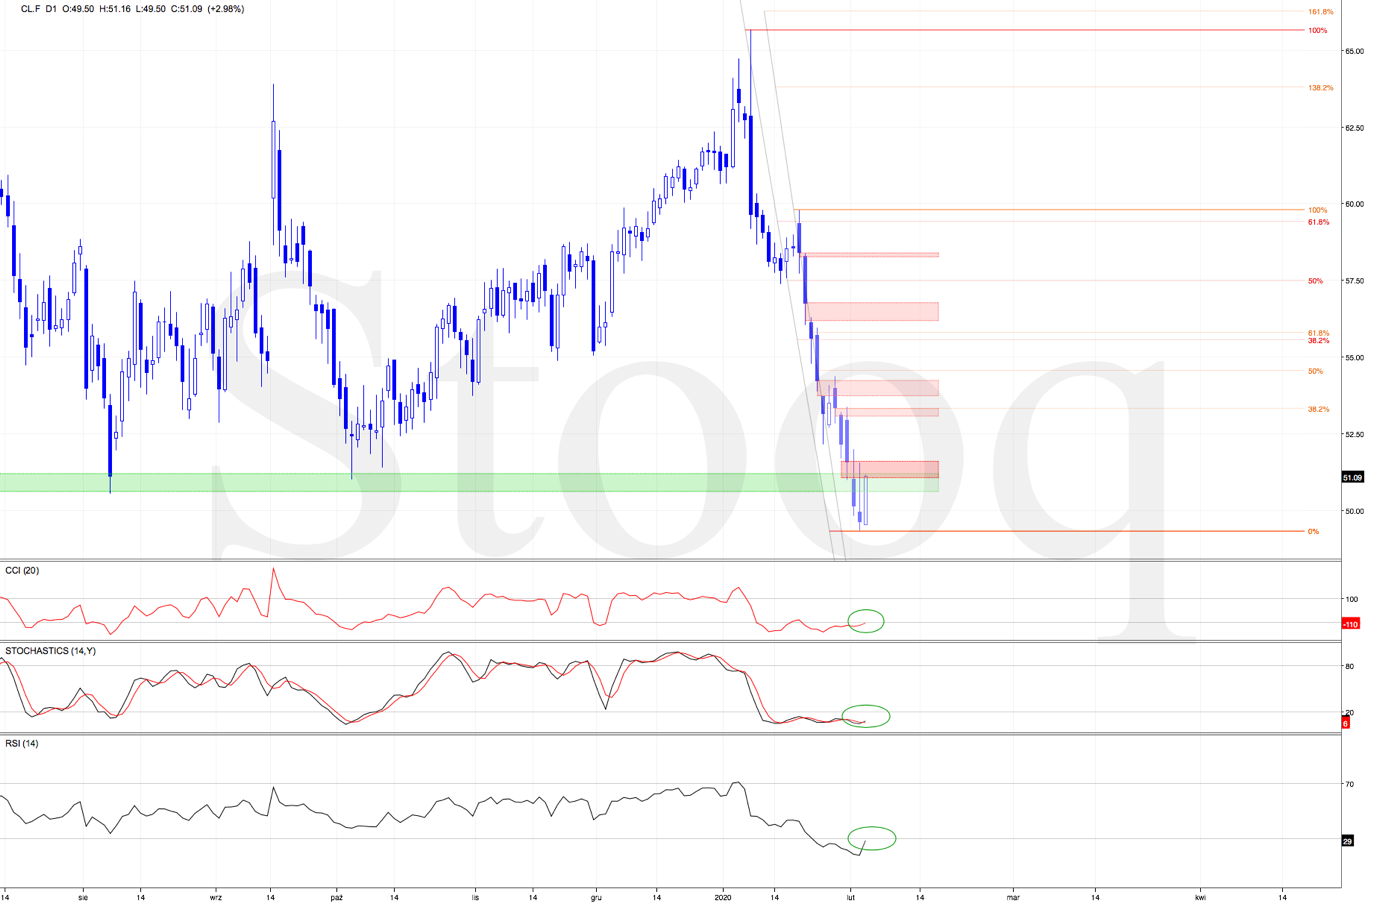
From this perspective, we see that crude oil futures moved sharply higher and not only closed the mentioned gap, but also reached the resistance area, which stopped them during yesterday's session (created by the previous lows and the next red gap).
Will they be strong enough to go higher?
As we mentioned earlier, the current position of the indicators is on their side (the Stochastic Oscillator generated a buy signal, while the CCI is very close to doing the same). However, in our opinion, as long as the nearest resistance zone remains in the cards the way to the north is closed and another decline can't be ruled out - especially if the EIA report disappoint market participants.
Nevertheless, if the bulls manage to close the day above the mentioned zone and invalidates the breakdown under the lower border of the red declining trend channel marked on the weekly chart, we'll consider opening long positions.
Summing up, the situation in crude oil is currently too unclear to justify opening any trading positions, but it seems that we might get more signs and decide to open a new trading position shortly.
As always, we'll keep you - our subscribers - informed.
Trading position (short-term; our opinion): No position is justified from the risk/reward perspective.
Thank you.
Nadia Simmons
Day Trading and Oil Trading Strategist
Przemyslaw Radomski, CFA
Editor-in-chief, Gold & Silver Fund Manager

