

Trading position (short-term; our opinion): Short positions (with a stop-loss order at $52.52 and the initial downside target at $45.80) are justified from the risk/reward perspective.
On Tuesday, crude oil wavered between small gains and losses, but finally lost 0.45% and closed another day below the 200-day moving average. Will we see further deterioration in the coming days?
Crude Oil’s Technical Picture
Let’s take a closer look at the charts and find out (charts courtesy of http://stockcharts.com).
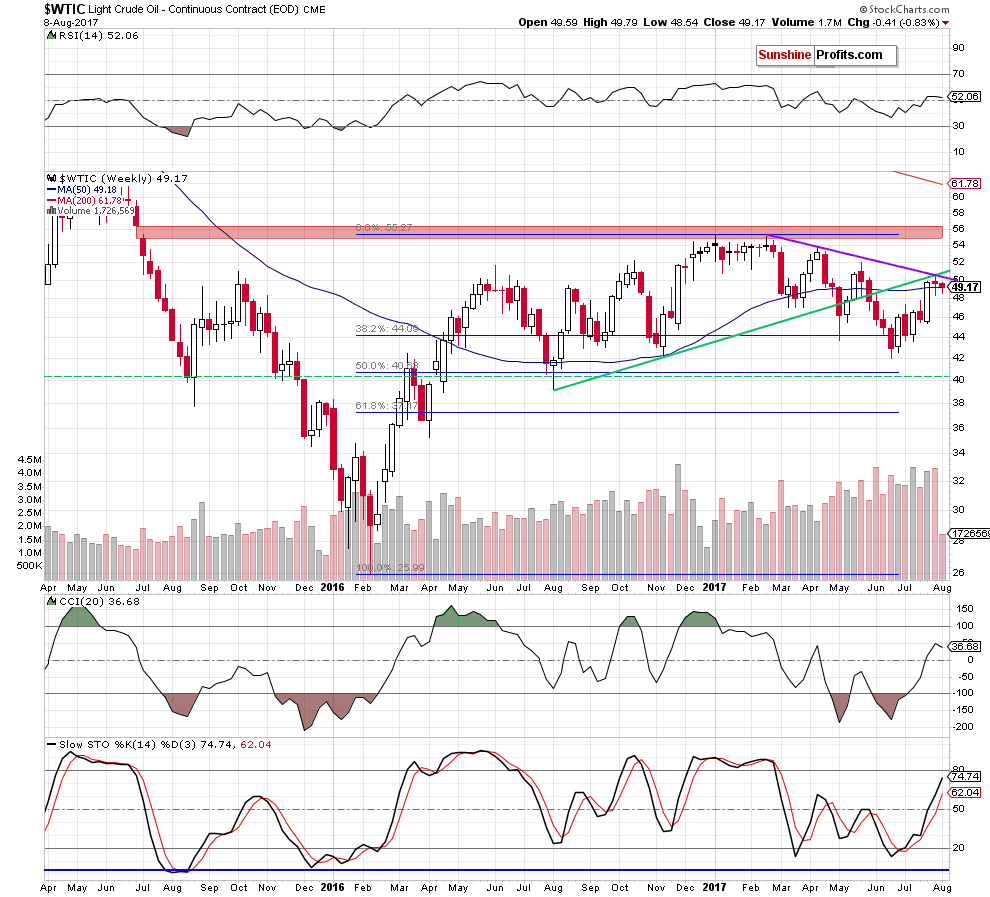
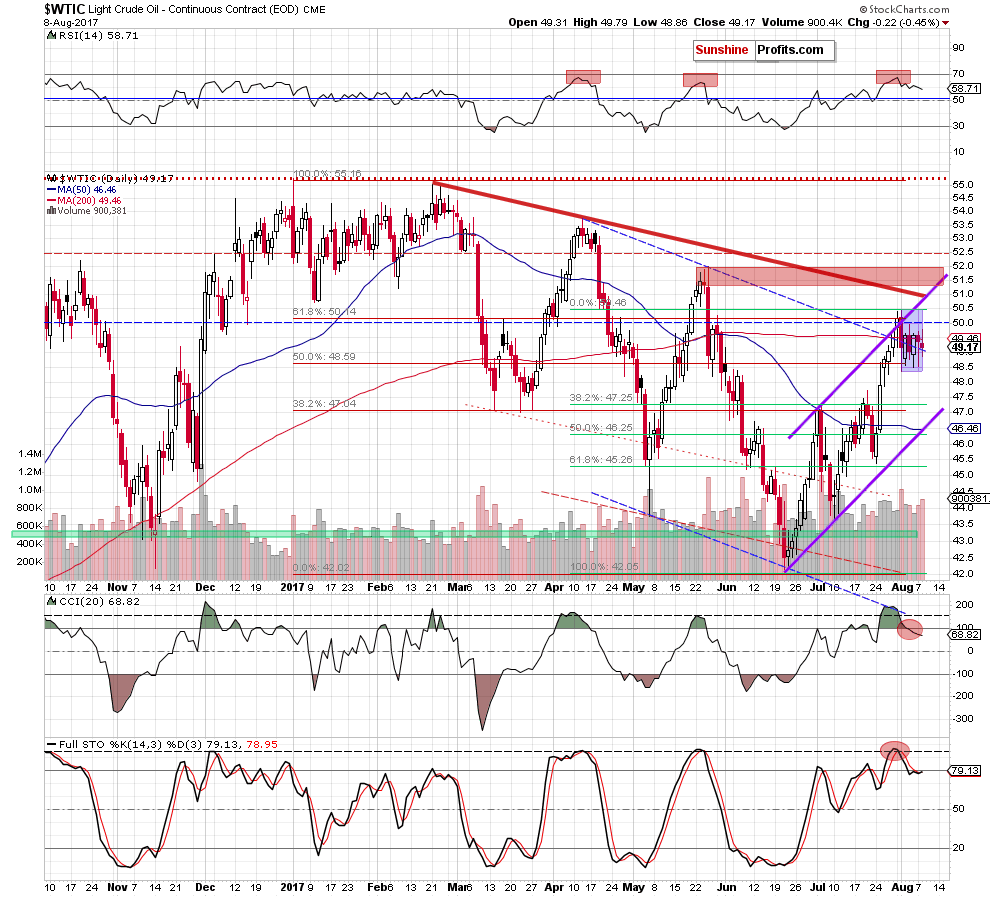
Yesterday, crude oil moved a bit higher after the market’s open, but the 200-day moving average in combination with the proximity to the barrier of $50 encouraged oil bears to act, which resulted in a pullback and a daily closure below the moving average. In this way light crude invalidated the earlier small breakout once again, which is a bearish sign, but the outlook was bearish anyway, so nothing really changed. Taking this fact into account, we believe that our Monday’s commentary remains up-to date also today:
(…) crude oil remains in the blue consolidation under the resistance area created by the 61.8% Fibonacci retracement (based on the entire 2017 downward move), the barrier of $50 and the upper border of the purple rising trend channel.
What does it mean for black gold?
Taking into account an invalidation of the breakout above these resistance levels and its potential negative impact on the price, the sell signals generated by the daily indicators (…) we believe that oil bears have many important reasons to act, which should result in further deterioration in the coming days – especially when we factor in the medium-term picture (the commodity closed the week under the previously-broken long-term green line based on the August and November lows and the medium-term purple line based on the February and April highs).
How low could the commodity go?
If light crude moves lower from current levels, the first downside target will be the last week low, which creates the lower border of the blue consolidation (at $48.37). If it is broken, the next downside target for bears will be around $47.25, where the 38.2% Fibonacci retracement based on the entire recent upward move is. However, taking into account all negative above-mentioned factors, we think that light crude will move even lower and test the lower border of the purple rising trend channel in the coming days (currently around $46.30). Please note that this area is also reinforced by the 50% Fibonacci retracement, which could pause for a bit further declines.
Summing up, short (already profitable) positions continue to be justified from the risk/reward perspective as crude oil remains under the 61.8% Fibonacci retracement (based on the entire 2017 downward move), the barrier of $50 and the previously-broken upper border of the purple rising trend channel. Additionally, yesterday’s move materialized on bigger volume than earlier increases, which suggests that oil bears are getting stronger and further deterioration is just around the corner.
Very short-term outlook: mixed with bearish bias
Short-term outlook: mixed with bearish bias
MT outlook: mixed
LT outlook: mixed
Trading position (short-term; our opinion): Short positions (with a stop-loss order at $52.52 and the initial downside target at $45.80) are justified from the risk/reward perspective. We will keep you – our subscribers – informed should anything change.
As a reminder – “initial target price” means exactly that – an “initial” one, it’s not a price level at which we suggest closing positions. If this becomes the case (like it did in the previous trade) we will refer to these levels as levels of exit orders (exactly as we’ve done previously). Stop-loss levels, however, are naturally not “initial”, but something that, in our opinion, might be entered as an order.
Thank you.
Nadia Simmons
Forex & Oil Trading Strategist
Przemyslaw Radomski, CFA
Founder, Editor-in-chief, Gold & Silver Fund Manager
Gold & Silver Trading Alerts
Forex Trading Alerts
Oil Investment Updates
Oil Trading Alerts

