

Trading position (short-term; our opinion): Small (half of the regular size) short positions (with a stop-loss order at $61.13 and the initial downside target at $52) are justified from the risk/reward perspective.
Although crude oil moved higher on Friday, the major resistance zone continues to keep gains in check. Will it withstand the buying pressure in the coming days? Is it possible that the relationship between crude oil, oil stocks and the general stock market will give us valuable clues about black gold future moves?
Crude Oil’s Technical Picture
Let’s examine the technical picture of crude oil (charts courtesy of http://stockcharts.com).
On Wednesday, we wrote the following:
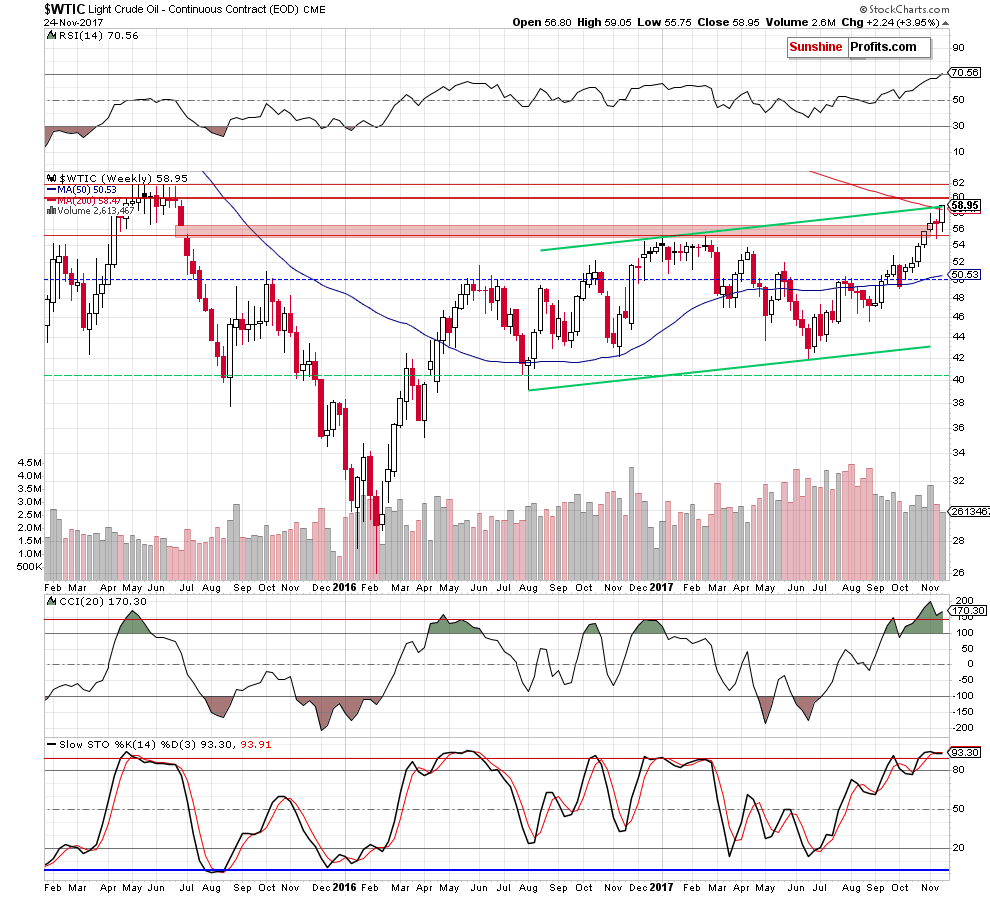
(…) not far from current levels we can notice an important resistance zone created by the upper border of the green rising trend channel and the 200-week moving average (…), which continues to block the way to higher levels.
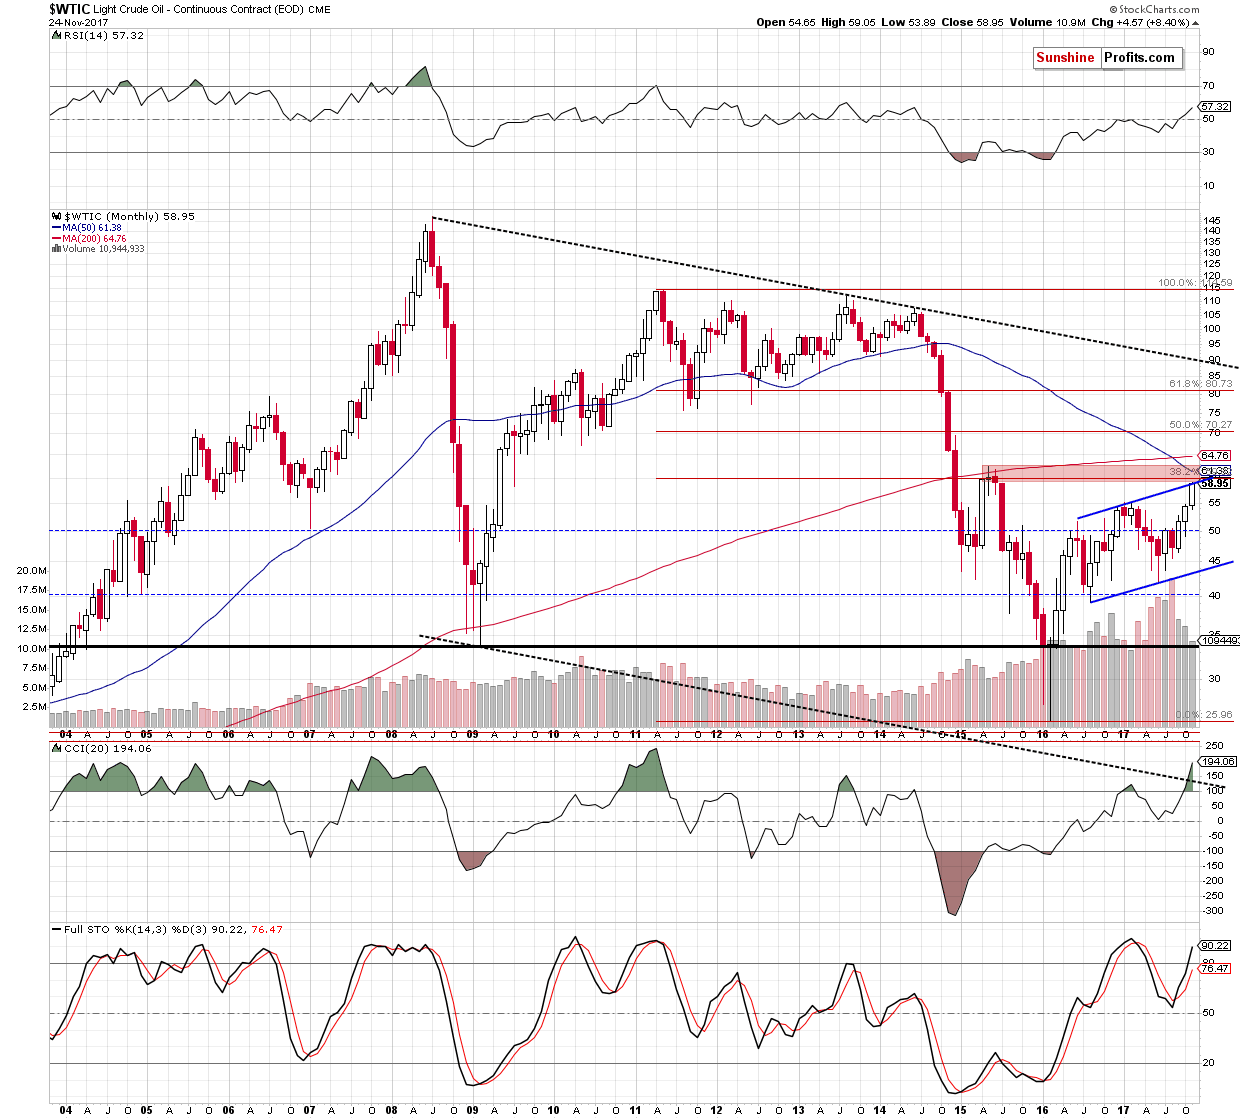
Additionally, when we zoom out our picture ant take a look at the monthly chart, we will see another solid resistance zone created by the 38.2% Fibonacci retracement, the barrier of $60, the 50-month moving average and May 2015 highs.
Therefore, in our opinion, even if light crude follows futures and moves a bit higher from current levels, the way to the north seems to be solidly closed, suggesting that another reversal and lower prices of black gold are still ahead of us.
From today’s point of view, we see that the situation developed in line with the above scenario and crude oil extended gains at the end of the previous week. Thanks to this increase, the commodity reached the upper border of the rising trend channel, but there was no breakout above it, which means that the situation in the broader perspective hasn’t changed much.
Additionally, the size of volume, which accompanied the last week’s move was smaller (compared to what we saw in the previous weeks), which together with the sell signal generated by the weekly Stochastic Oscillator and thee proximity to the next solid resistance zone marked on the monthly chart (created by the 38.2% Fibonacci retracement, the barrier of $60, the 50-month moving average and May 2015 highs) increasing the probability that reversal and lower prices of black gold are just around the corner.
On top of that, the pro-bearish scenario is also reinforced by the current situation in the oil-to-stocks and oil-to-oil stocks ratios.
Crude Oil, General Stock Market and Oil Stocks.
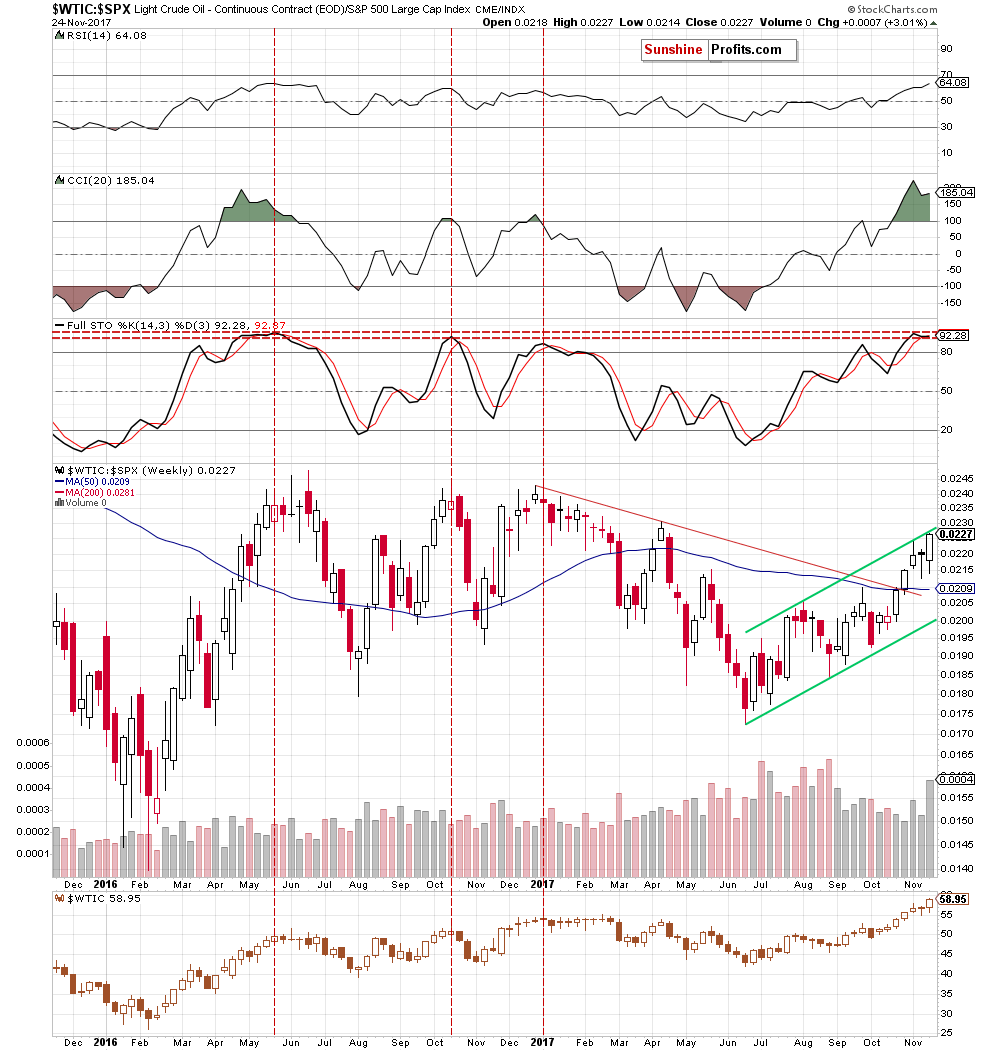
Looking at the above chart, we see that although the oil-to-stocks ratio moved higher in the previous week, it is still trading inside the green rising trend channel. As a reminder, the upper line of the formation triggered a decline at the beginning of the month, which suggests that we may see a similar price action in the coming week – especially when we factor the current position of the weekly indicators (the sell signal generated by the Stochastic Oscillator remains in place and there is a negative correlation between the CCI and the ratio).
When we take a closer look at the oil-to-oil stock ratio, we can also notice several bearish factors.
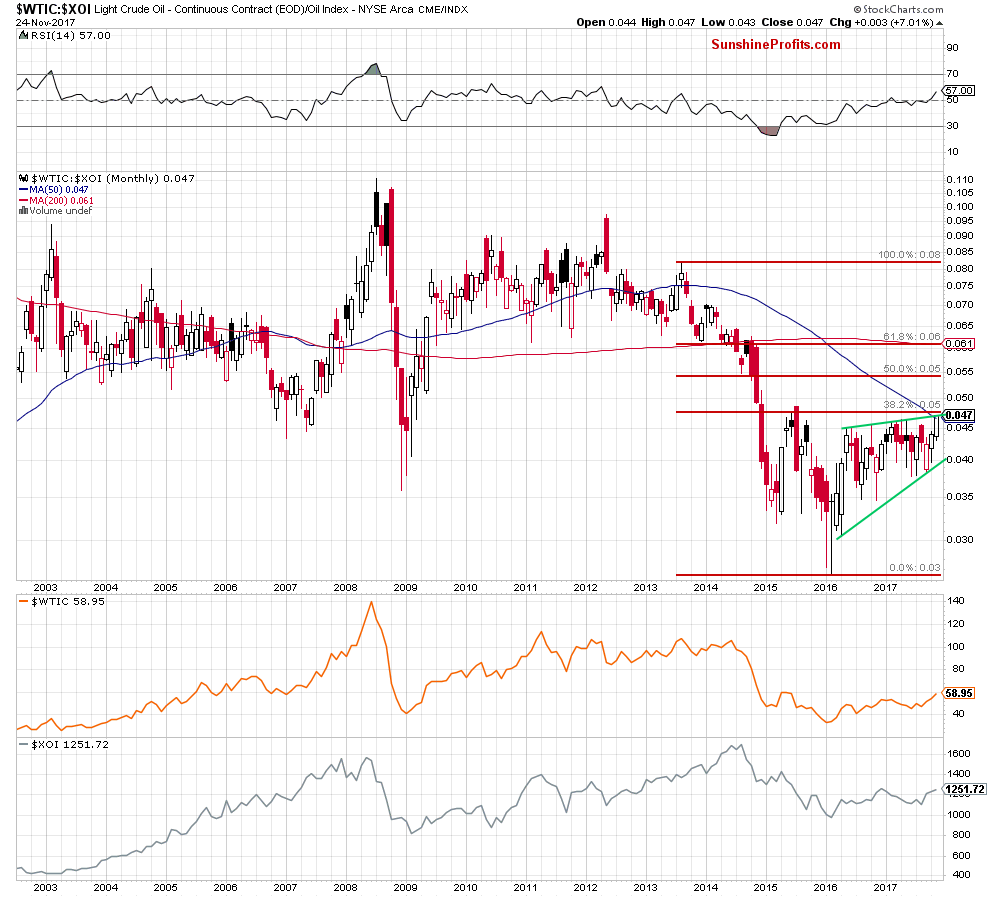
As you see on the above chart, the ratio climbed to the major resistance zone created by the upper border of the green rising wedge, the 50-month moving average and the 38.2% Fibonacci retracement, which seems to be strong enough to stop further improvement and could encourage oil bears to act in the coming week.
If this is the case, and oil bears show their strength, crude oil will reverse and decline to (at least) the bottom of the previous pullback (around $55) in the following days.
Summing up, short positions continue to be justified from the risk/reward perspective as crude oil, the oil-to-stocks and oil-to-oil stocks ratios climbed to very important resistance zones, which will likely encourage oil bears to act in the coming days.
Very short-term outlook: mixed with bearish bias
Short-term outlook: mixed with bearish bias
MT outlook: mixed
LT outlook: mixed
Trading position (short-term; our opinion): Small (half of the regular size) short positions (with a stop-loss order at $61.13 and the initial downside target at $52) are justified from the risk/reward perspective. We will keep you – our subscribers – informed should anything change.
Thank you.
Nadia Simmons
Forex & Oil Trading Strategist
Przemyslaw Radomski, CFA
Founder, Editor-in-chief, Gold & Silver Fund Manager
Gold & Silver Trading Alerts
Forex Trading Alerts
Oil Investment Updates
Oil Trading Alerts

