

Trading position (short-term; our opinion): No positions are justified from the risk/reward perspective.
During Friday’s session crude oil moved higher and almost touched the barrier of $70. Will this psychological resistance stop further improvement in the coming week?
Let's examine the charts below (charts courtesy of http://stockcharts.com).
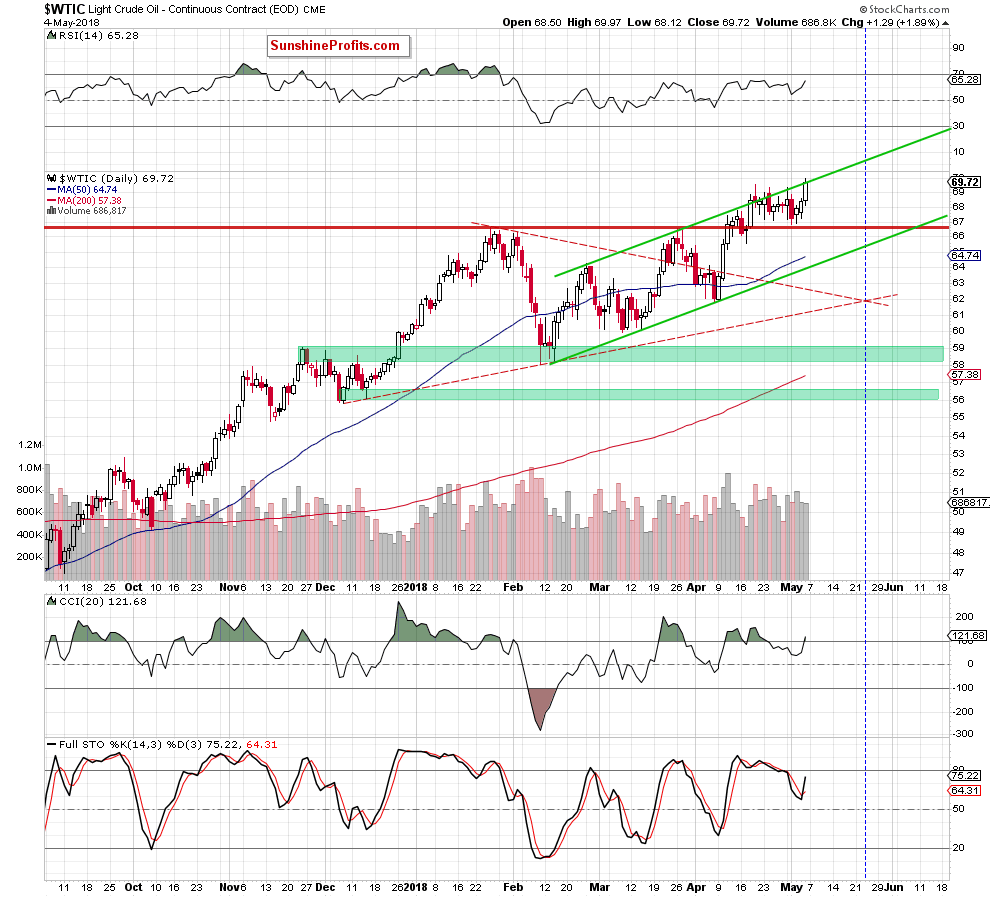
Looking at the daily chart, we see that crude oil increased once again on Friday, which resulted in a fresh peak and a re-test of the strength of the upper border of the green rising trend channel. Despite this improvement, there was no daily closure above this resistance line.
Nevertheless, when we take a closer look at the above chart, we see that although Friday’s move materialized on smaller volume than earlier upswings, the Stochastic Oscillator generated a buy signal and the CCI invalidated the earlier sell signal.
Additionally, the situation in the WTIC:UDN ratio improved, which raises worries about oil bears condition.
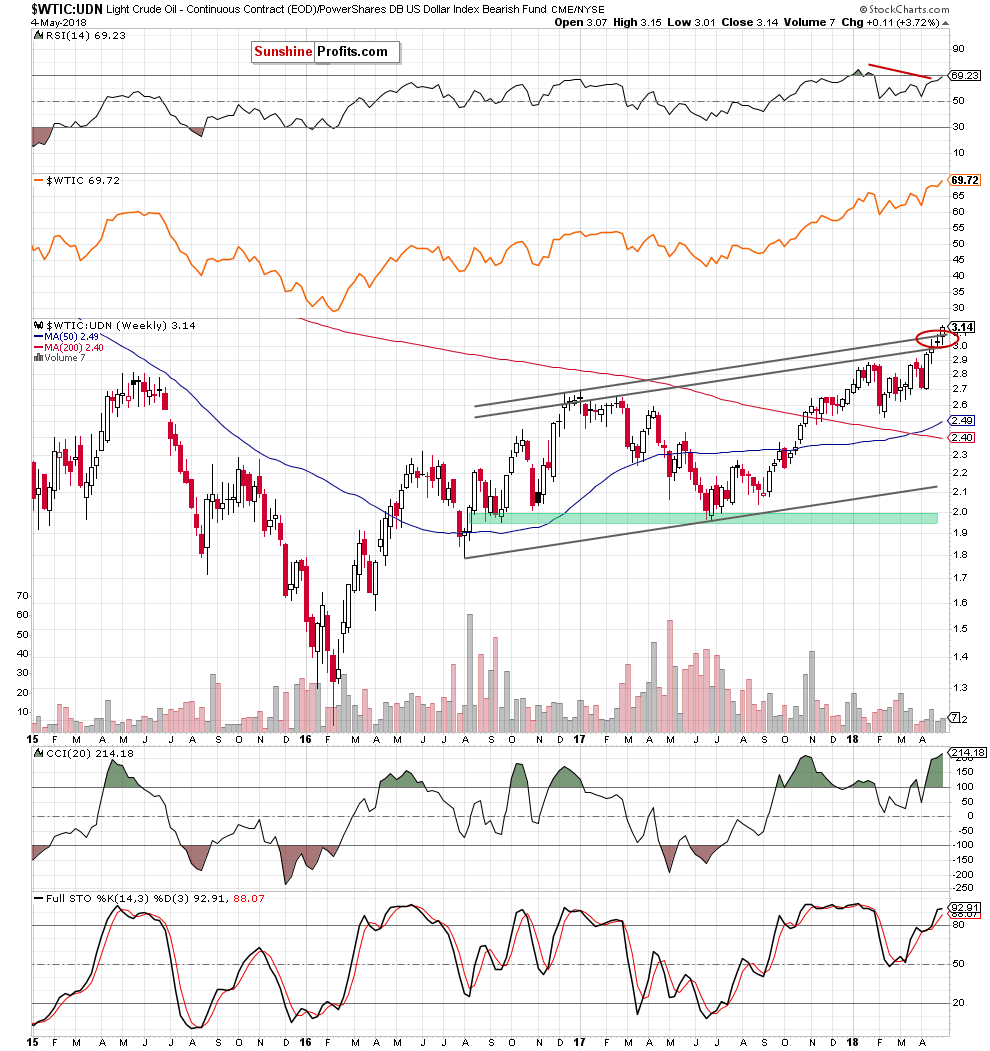
From the medium-term perspective, we see that the ratio broke above the strong resistance area created by the upper border of the black rising trend channel (in terms of intraweek highs and weekly closures), which shows oil bulls strength.
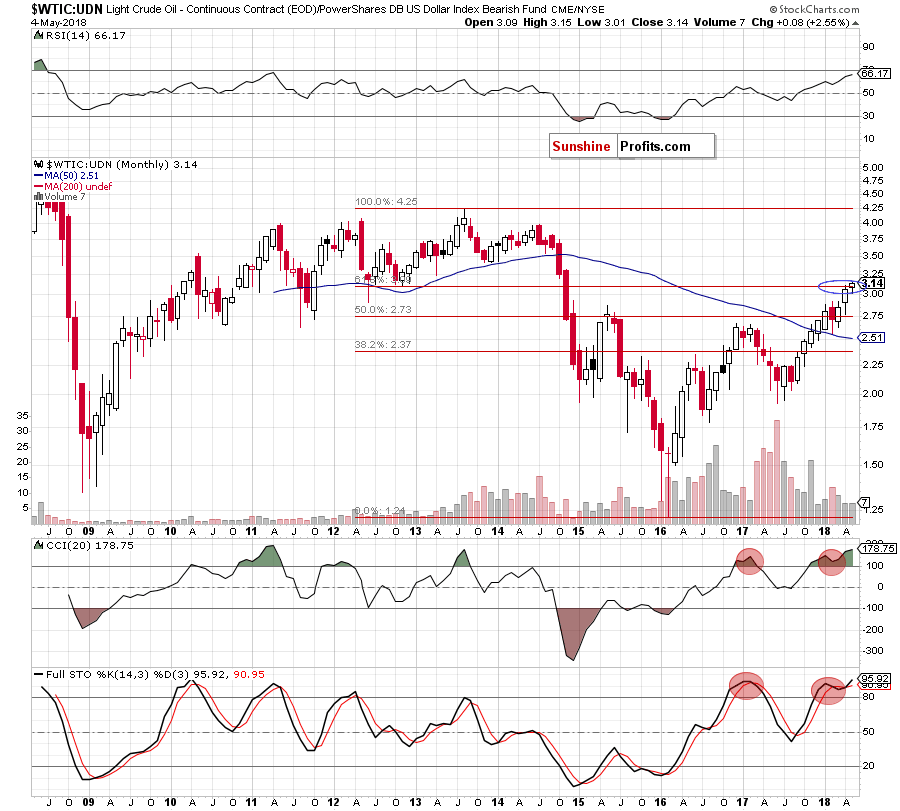
Thanks to this increase, the ratio also climbed above the 61.8% Fibonacci retracement seen on the long-term chart below.
Taking all the above in to account, it seems that oil bulls didn’t say the last word and further improvement can’t be ruled out. Therefore, we think that closing our short positions is justified from the risk/reward perspective.
But how high oil bulls could push black gold if they manage to break above the barrier of $70? We think that the best answer to this question will be the long-term chart of light crude.
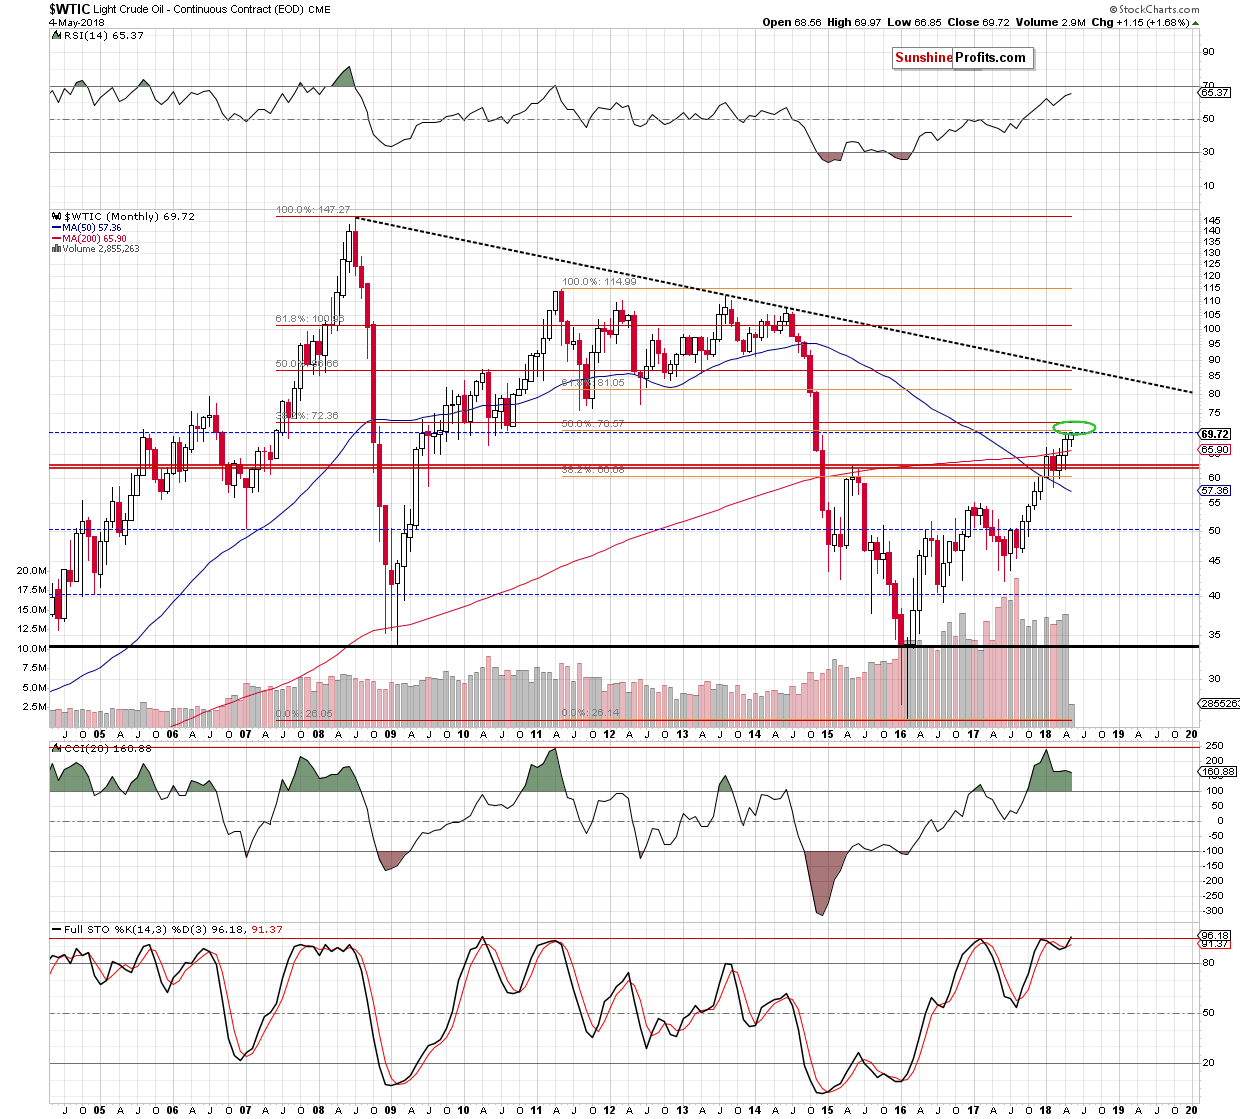
As you see on the above chart, if the barrier of $70 is broken, the next upside target will be around $70.57 (the 50% Fibonacci retracement based on the 2011-2016 downward move) or we could even see an increase to around $72.36, where the 38.2% Fibonacci retracement based on the entire 2008-2016 decline is.
Trading position (short-term; our opinion): No positions are justified from the risk/reward perspective. We will keep you – our subscribers – informed should anything change.
On an administrative note, due to travel plans, there will be no Oil Trading Alerts in the following several days. The next Oil Trading Alert is scheduled for Friday, May 11, 2018.
Thank you.
Nadia Simmons
Forex & Oil Trading Strategist
Przemyslaw Radomski, CFA
Founder, Editor-in-chief, Gold & Silver Fund Manager
Gold & Silver Trading Alerts
Forex Trading Alerts
Oil Investment Updates
Oil Trading Alerts

