

Trading position (short-term; our opinion): No positions are justified from the risk/reward perspective.
On Tuesday, crude oil moved sharply lower and broke below several important supports. Is realization of the pro-declining scenario enough to satisfy the bears? Or maybe fresh lows are still ahead of us?
Let’s analyze the charts below (charts courtesy of http://stockcharts.com).
In our Tuesday alert, we wrote the following:
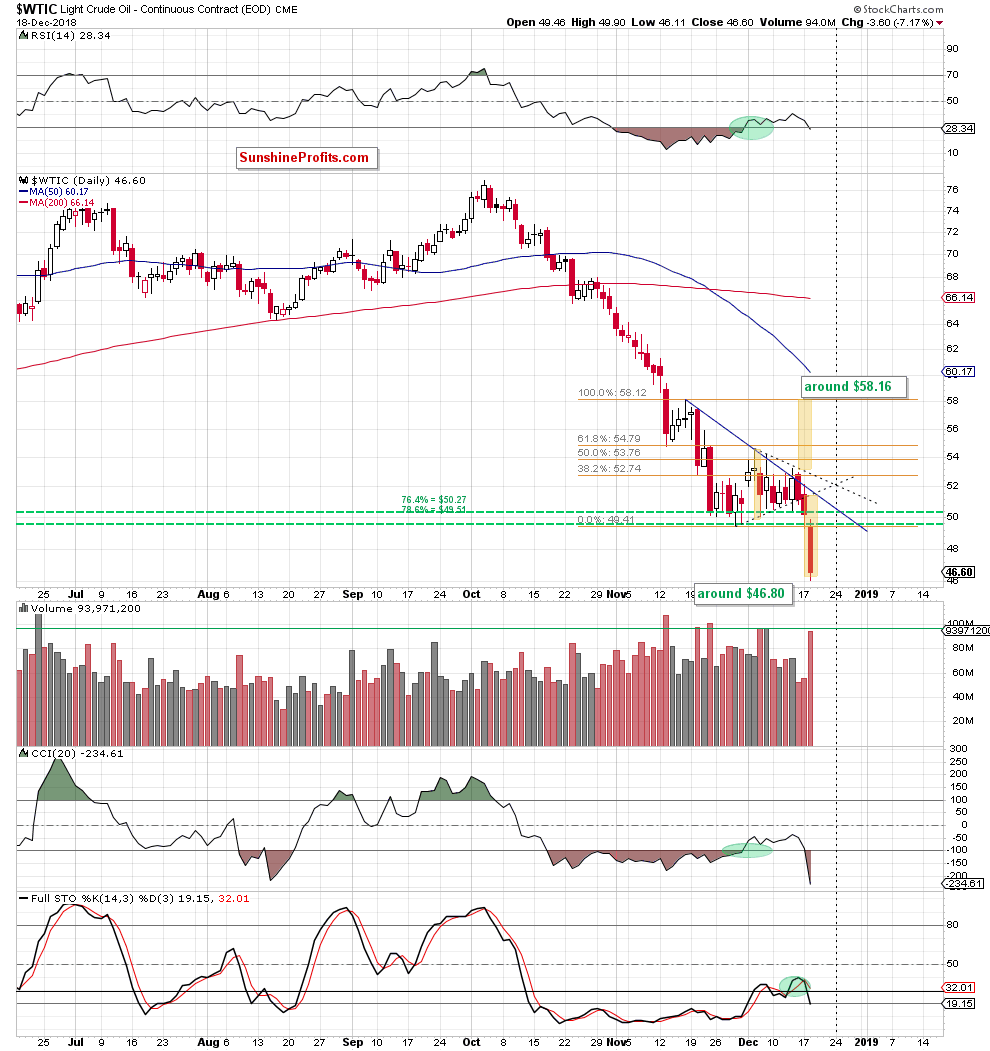
(…) although oil bulls took the price of crude oil higher after Monday’s session open, the blue declining resistance line stopped them quite quickly causing a reversal and a drop below the lower border of the black triangle (marked with dashed lines).
This bearish development triggered further deterioration and a decline not only below the barrier of $50, but also under the support area crated by the 76.4% and 78.6% Fibonacci retracements in the following hours.
(…) thanks to these circumstances crude oil hit a fresh 2018 low, but then rebounded slightly and closed the day above the previously-broken late-November low, the barrier of $50 and the 78.6% retracement, invalidating the earlier breakdowns.
Despite the fact that these factors may look quite encouraging and positive, in our opinion we should not trust them. Why?
First, the commodity closed yesterday’s session well below the 200-week moving average, which confirms that the last week’s increase and Monday’s upswing after the market’s open were nothing more than just verifications of the previous breakdown under this important resistance level. Therefore, in our opinion, as long as there is no successful climb above it a bigger move to the upside is questionable.
Second, yesterday’s move materialized on higher volume, showing the increased involvement of sellers in the yesterday's move to the south.
Third, the Stochastic Oscillator generated a sell signal, giving oil bears one more reason to act in the very near future.
Last but not least, light crude closed Monday’s session under the lower border of the black dashed triangle, which means that as long as there is no invalidation of the breakdown under this line a pro-bearish scenario from our Friday’s alert remain in the cards:
(…) we would like to draw your attention to the above-mentioned black triangle marked with dashed lines. As you see on the daily chart, we marked with yellow two potential scenarios - depending on which side of the market wins and in which direction the breakthrough will take place.
If oil bulls (…) fail and the sellers trigger a decline below the lower border of the triangle and the recent lows, we can see not only a fresh 2018 low, but also a drop to around $46.80, where the size of the downward move will correspond to the height of the triangle.
(…) before oil bears take the price of black gold to this level, they will have to defeat one more bulls’ ally, which we wrote about in our Oil Trading Alert published a week ago:
(…) please keep in mind that if oil bulls fail in this area and allow their opponents to push the price of black gold to a fresh low, we can see a decline even to around $47.20, where the long-term green rising support line (marked on the weekly chart (…)) based on the August 2016 and the June 2017 lows currently is.
From today’s point of view, we see that oil bears took the price of black gold lower as we had expected. Thanks to yesterday’s downward move they not only realized the Friday pro-declining scenario, but also managed to push crude oil under the above-mentioned long-term green rising support line marked on the weekly chart below.
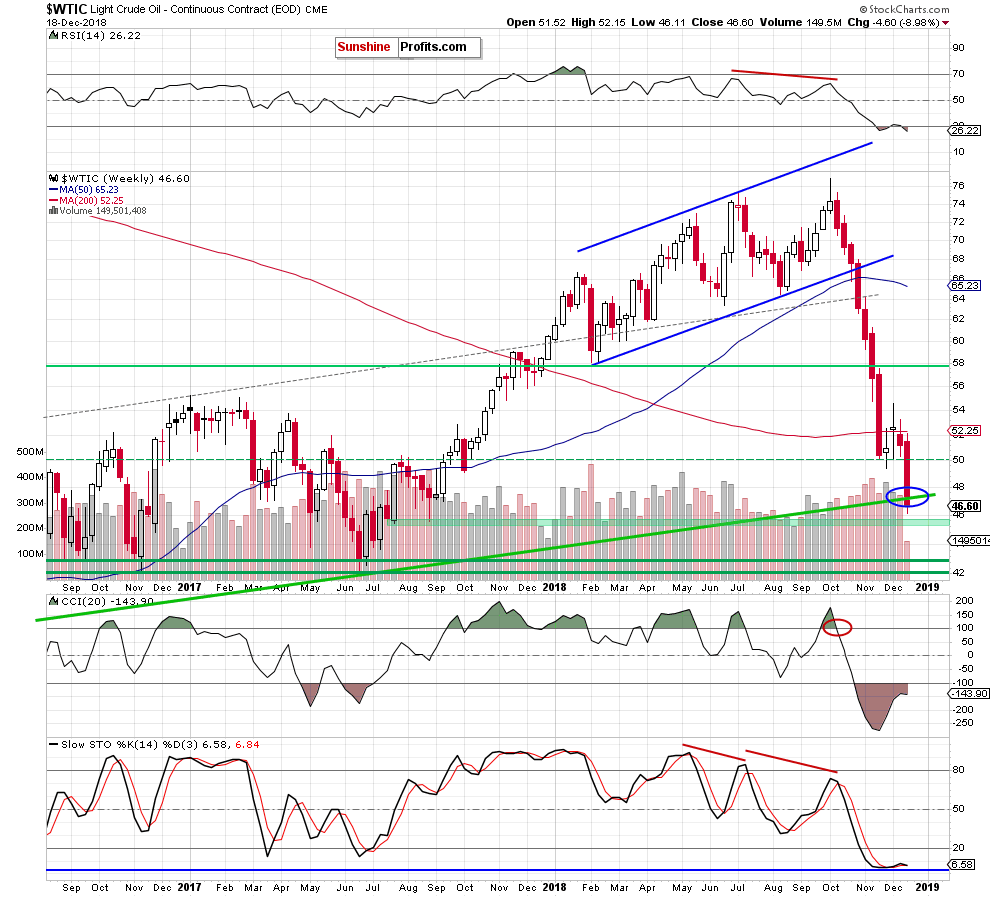
This is a negative development (it will turn into bearish if the sellers keep black gold below this important support), which suggests that if oil bulls do not invalidate yesterday’s breakdown, we’ll likely see further deterioration in the coming days.
How low could light crude go?
In our opinion, if the commodity extends losses from current levels, crude oil will test (at least) the green support zone based on the late-July and late-August lows (around $45.40-$45.62) in the very near future.
At this point, it is worth noting that in this area there is one more additional support, which can encourage the buyers to act. What do we mean by that? Let’s take a look at the long-term chart below.
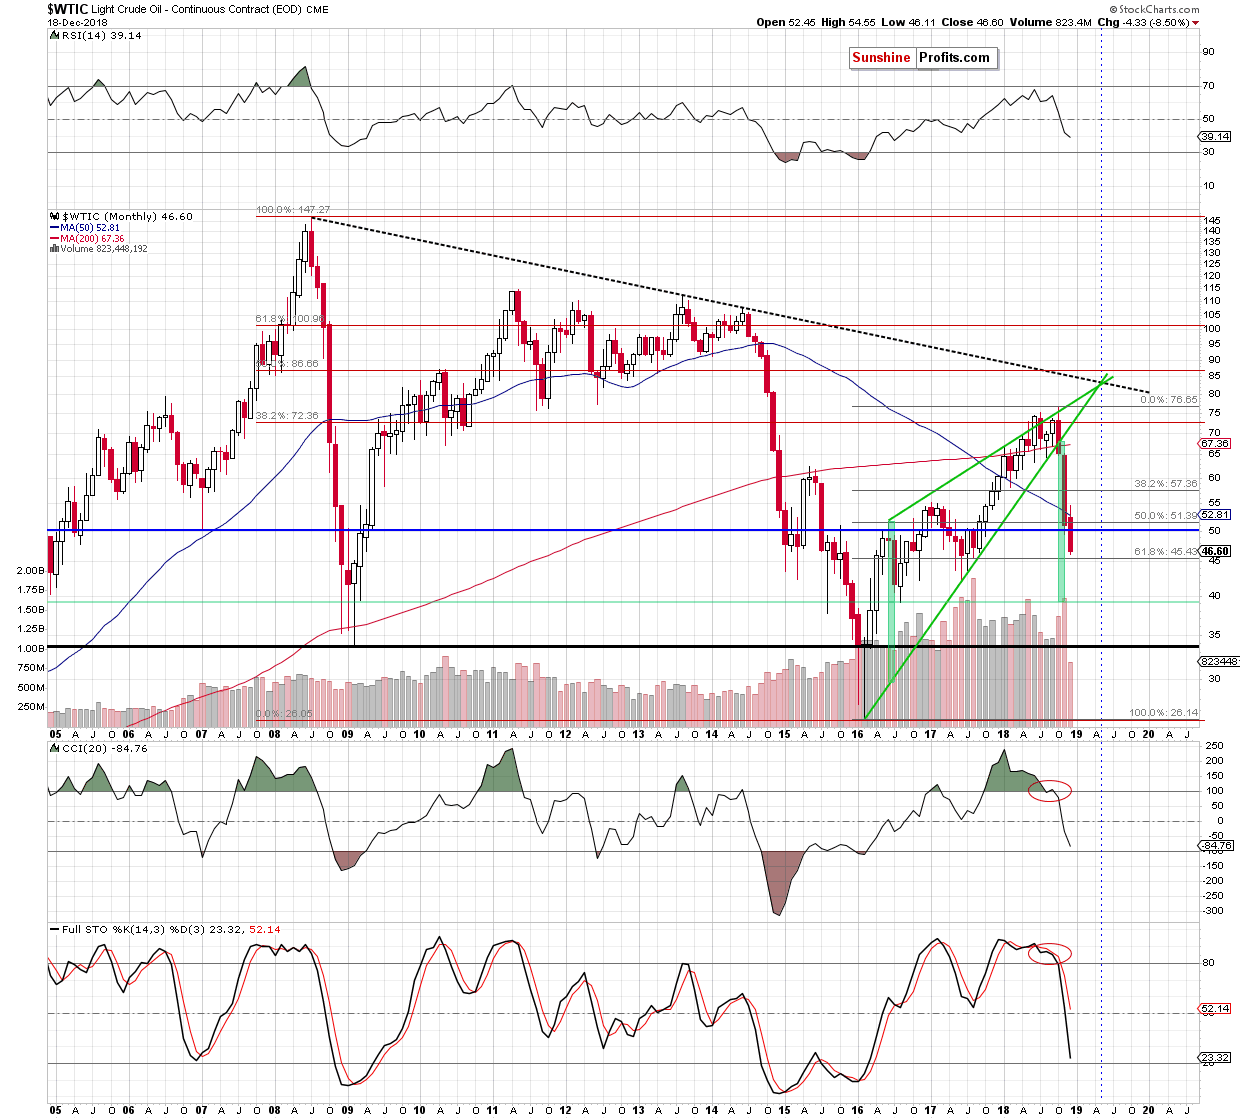
From this perspective, we see that not far from current levels (inside the above-mentioned support area) oil bears will have to face with the 61.8% Fibonacci retracement based on the entire 2016-2018 upward move.
Nevertheless, if oil bulls do not stop them there, the way to June 2017 lows (around $42.05-$43.16) will be open.
Summing up, the short-term situation has deteriorated significantly after crude oil extended sharply loses and broke below the long-term green rising support line marked on the weekly chart. If oil bulls do not manage invalidate yesterday’s breakdown, the way to lower supports will be open.
Trading position (short-term; our opinion): No positions are justified from the risk/reward perspective. We will keep you informed should anything change, or should we see a confirmation/invalidation of the above.
Thank you.
Nadia Simmons
Forex & Oil Trading Strategist
Przemyslaw Radomski, CFA
Founder, Editor-in-chief, Gold & Silver Fund Manager
Gold & Silver Trading Alerts
Forex Trading Alerts
Oil Investment Updates
Oil Trading Alerts

