

Trading position (short-term; our opinion): No positions are justified from the risk/reward perspective.
Friday’s session showed that the fierce battle for the nearest resistance zone continues in the best and none side of the market intends to surrender without a fight. Who has gained and who has lost?
Let’s examine the charts below (charts courtesy of http://stockcharts.com).
Technical Picture of Crude Oil
Let’s start today’s alert with the medium-term chart of crude oil.
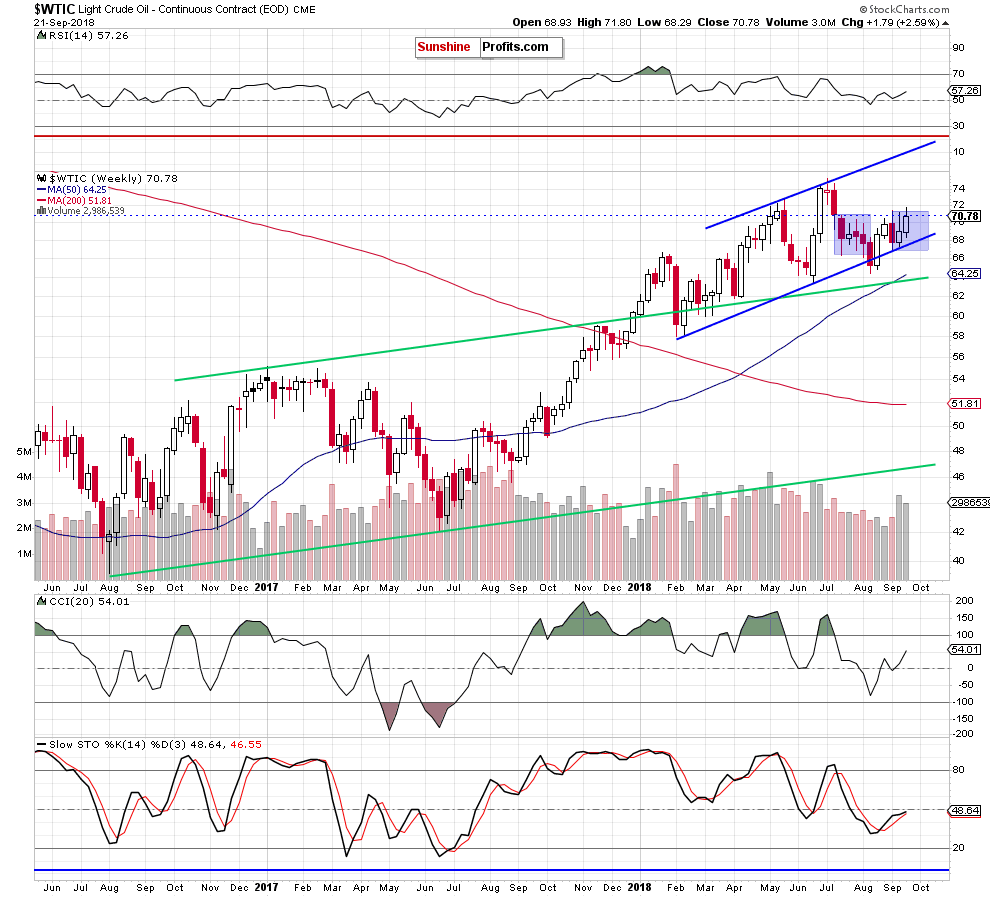
From this perspective, we see that although black gold gained 2.59% in the previous week, the overall situation hasn’t changed much as the price remains inside the second blue consolidation between early September peak of $71.40 and low of $66.86.
Unfortunately, such price action means that as long as there is no breakout above the upper line of the formation (or a breakdown under the lower border) another bigger move to the upside (or downside in the case of the breakdown) is not likely to be seen and short-lived moves in both directions can’t be ruled out.
An additional uncertainty (as to the direction of the next move) is introduced by the volume and signals generated by the indicators. Why? Because despite the last week’s price increase, the volume was lower than a week earlier, which shows a smaller involvement of the buyers in market’s transactions.
On the other hand, the buy signal generated by the Stochastic Oscillator continues to support oil bulls and another attempt to move higher.
Can we infer anything more from the very short-term chart? Let’s check below.
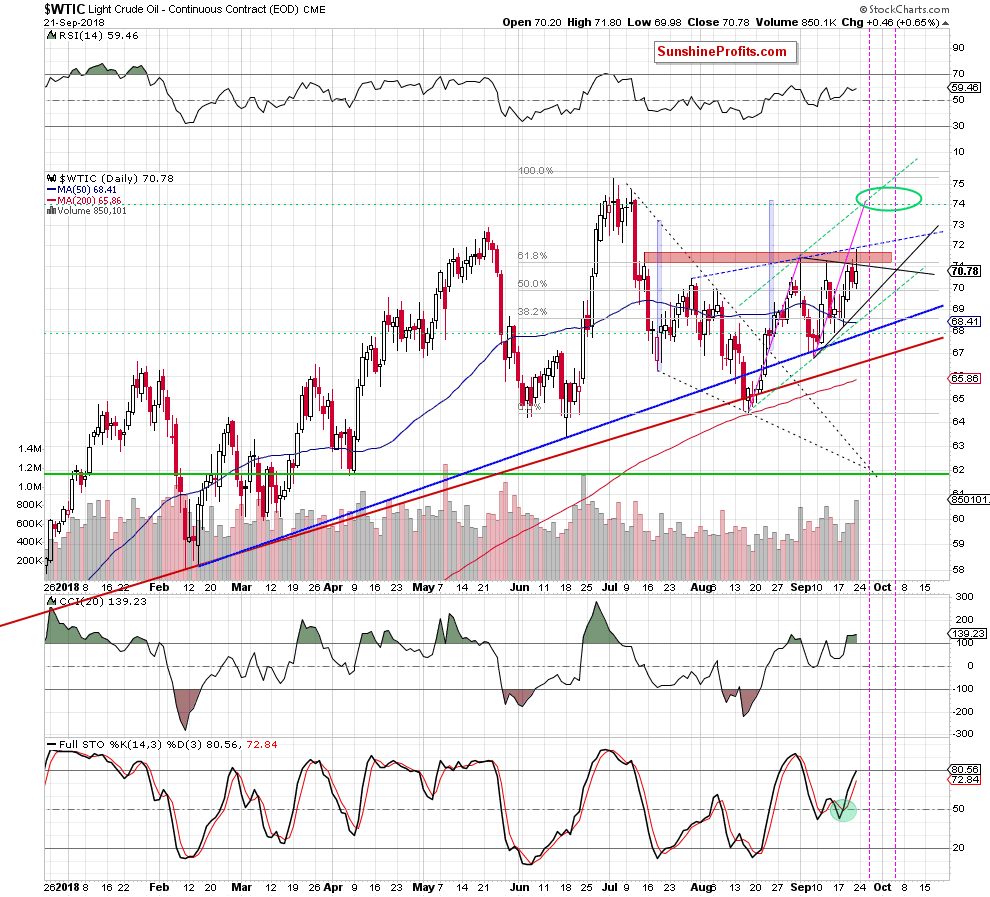
Looking at the daily chart, we see that the price of the commodity increased once again after the Friday market open, climbing above the upper line of the black triangle and slightly above the red resistance zone, reaching the blue dashed line, which is a potential neck line of the reverse head and shoulders pattern.
Despite this upswing, it turned out in the following hours that this improvement was very temporary and light crude came back below all the above-mentioned resistances, invalidating the earlier small breakout.
Although this is a bearish development, the buy signal generated by the Stochastic Oscillator remains in the cards, which suggests that one more attempt to go higher is still likely.
Taking all the above into account we believe that the comments that we made on Friday remain up-to-date also today:
(…) price drop caused an invalidation of a tiny breakout above the upper border of the black trend channel, which emphasizes the importance of the red resistance zone for the future of light crude and shows that oil bears defend it very fiercely.
Therefore, we believe that as long as there is no successful breakout above it and the blue dashed line based on late-July and early-September peaks (the neck line of a potential reverse head and shoulders about which we wrote on September 10, 2018) a bigger move to the upside is doubtful and short-lived moves in both directions inside the black triangle should not surprise us.
Nevertheless, if oil bulls show strength and manage to push the price of black gold above the neck line of the potential pattern, we’ll likely re-open long positions on the following day. As always, we’ll keep you - our subscribers - informed should anything change.
Trading position (short-term; our opinion): No positions are justified from the risk/reward perspective.
Thank you.
Nadia Simmons
Forex & Oil Trading Strategist
Przemyslaw Radomski, CFA
Founder, Editor-in-chief, Gold & Silver Fund Manager
Gold & Silver Trading Alerts
Forex Trading Alerts
Oil Investment Updates
Oil Trading Alerts

