

Trading position (short-term; our opinion): No positions are justified from the risk/reward perspective.
In our previous analysis, we wrote that the price of crude oil appears to be forming a bullish weekly reversal, but it wasn’t yet clear how the week is going to end. It is now clear as we have all the data and we see that the price of black gold has indeed reversed last week. How significant are these implications for the following days and weeks?
Let’s start by taking a closer look at the long-term crude oil chart and once again going through the context of the recent price moves.
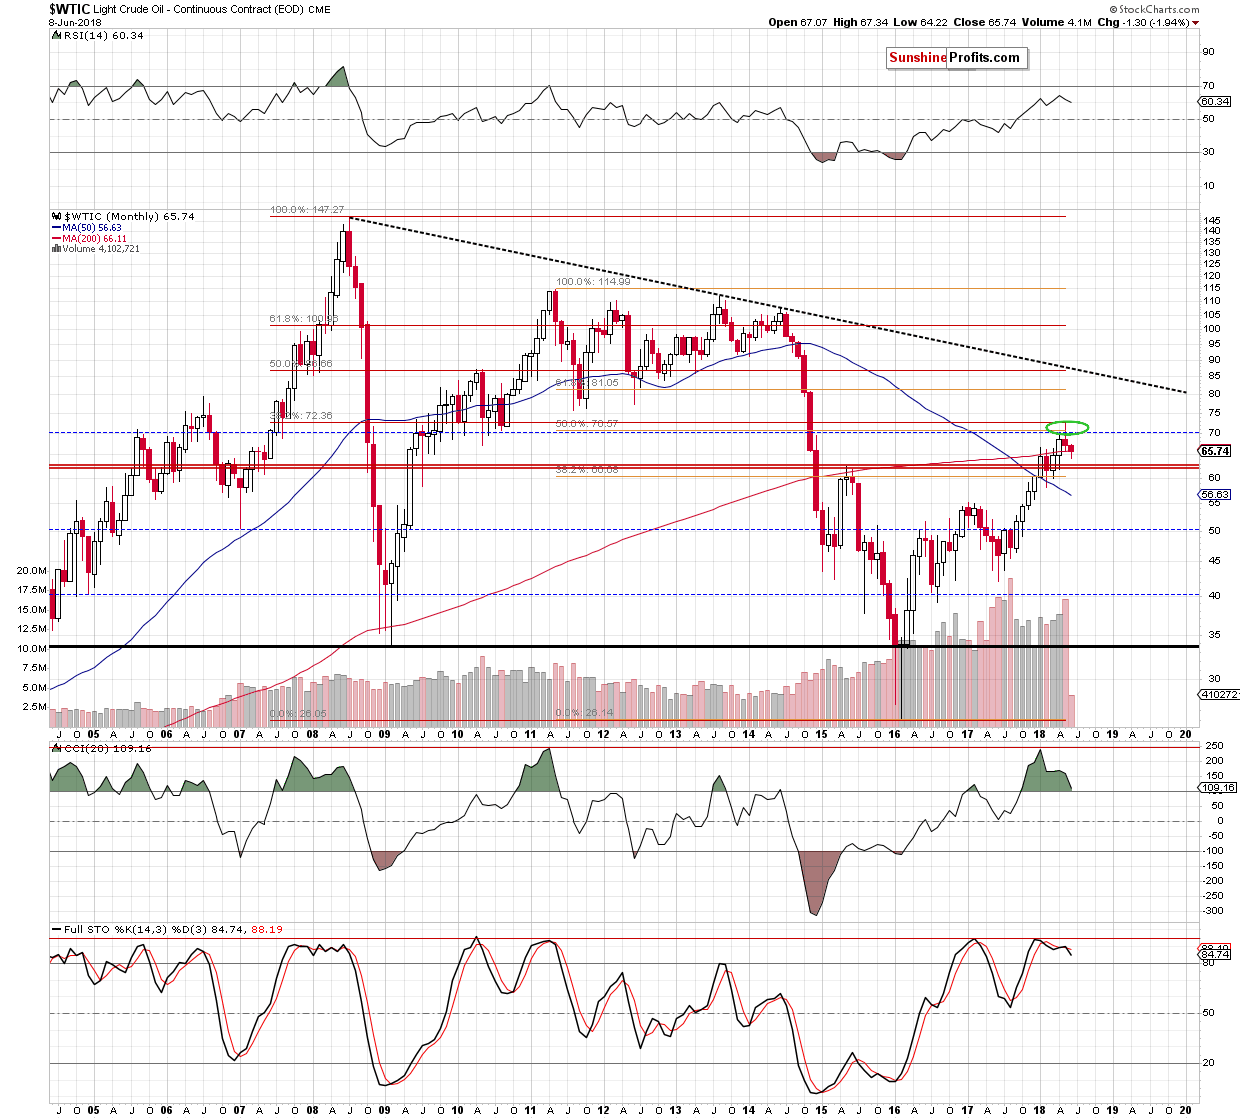
In short, our previous comments on the above chart remain up-to-date:
Crude oil’s May reversal is not a 100% classic book example as crude oil have erased some of the late-month declines, but it’s clear enough for the implications to be bearish. This is especially the case since the price of black gold reversed after reaching two important, long-term resistance levels: 50% Fibonacci retracement based on the 2011 – 2016 decline and (even more importantly) the 38.2% Fibonacci retracement based on the 2008 – 2016 decline.
Therefore, crude oil is likely to move lower not only in terms of days, but in terms of weeks, and perhaps even months.
The above implications are already playing out – despite this week’s comeback, crude oil is still over $1 below the May close and the odds are that it’s going to be much lower before June is over.
The CCI indicator in the lower part of the above chart shows why the implications could extend well beyond this month. Earlier this year, the indicator moved above 200 and now it’s moving lower and it’s about to break below the 100 level.
There were only two similar cases to the current one in the past decade. The first was in mid-2008 and the second one was in mid-2011. The former was followed by many tens of dollars of declines and the latter was followed by a decline of “only” over $35. The May top was formed at about $72, and it’s now at about $66, which means that it’s not even close to being as big as any of the previous declines that were similar with regard to CCI.
This means that crude oil is likely to fall further before the decline is over and the time factor adds credibility to this prediction. After all, both above-mentioned declines started in the middle of the year and that’s approximately where we are right now.
Having said that, let’s take a look at the weekly price changes.
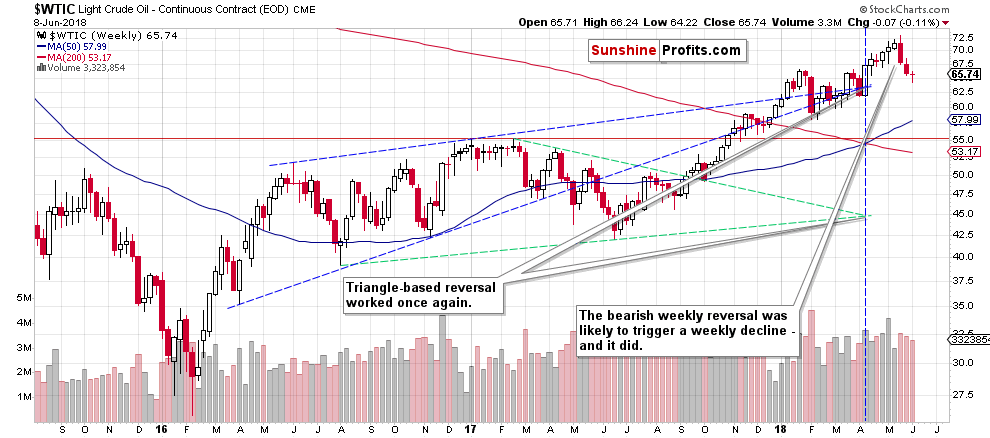
In Friday’s analysis, we commented on the above chart in the following way:
As we indicated earlier, crude oil has almost formed a bullish reversal candlestick. It’s clearly visible on the above chart, but the week is not over yet, so a lot could happen today. At the time of writing these words, crude oil is down by 33 cents, which means that if it closed at these prices, we would still have a weekly bullish reversal. The week would actually end in the red, but the reversal would have bullish implications anyway.
Crude oil ended the day 21 cents lower, which means that it moved 12 cents higher since we wrote the above. Therefore, the bullish implications of the above were not invalidated. There is, however, one factor that one needs to consider when estimating the strength of the bullish signal.
The volume.
The volume was not very low, but it was not huge, and it was not big on a relative basis. In fact, it was average and lower than what we had seen in the previous two weeks. What does it mean? It means that the true implications of the reversal are quite weak. Sure, we may get a few days of higher prices, but it’s not very likely – definitely nothing worth betting on. It seems more likely that we’ll get some kind of bearish signs shortly, for instance in the form of a rally on weak volume that could make us re-enter the short positions that we had profitably closed several days ago.
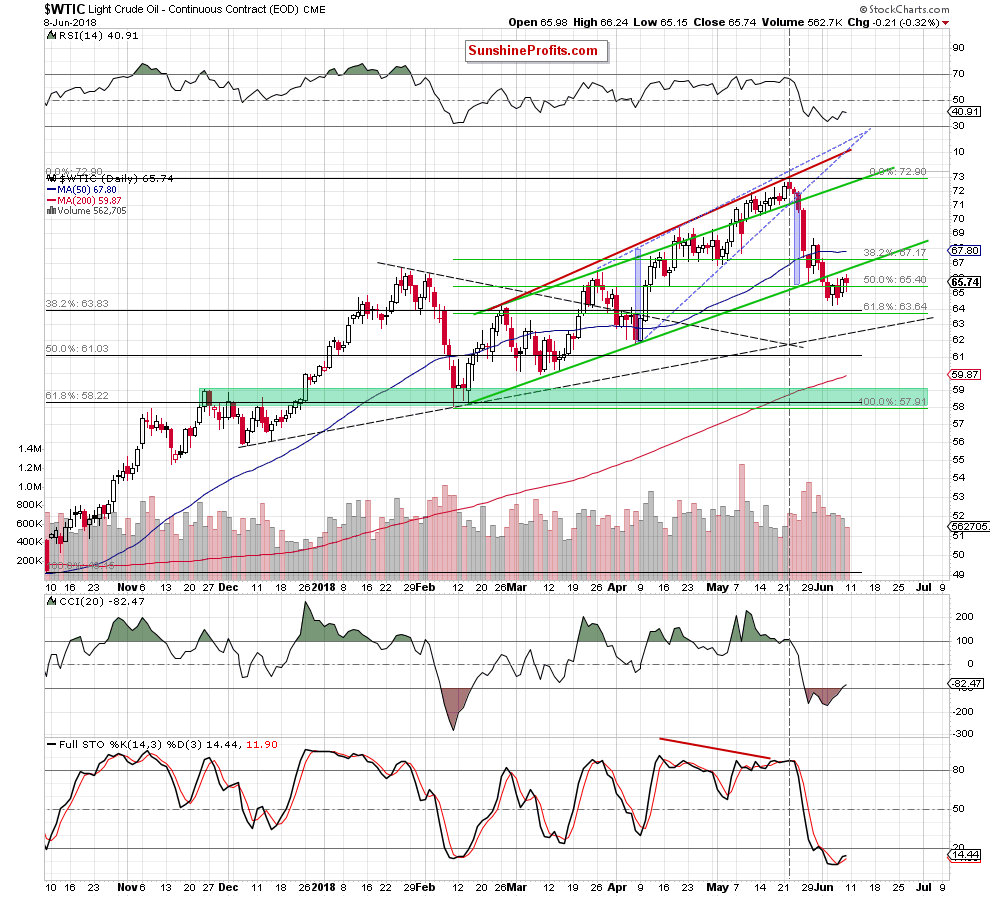
So far, we have not seen anything like that. The buy signals from the CCI and Stochastic indicators are in place, which suggests higher prices, but at the same time the upside potential seems very limited. Crude oil just broke below the rising green support/resistance line, so it could now simply move to it and verify the breakdown. The upside is therefore at about $66.60 – a bit less than a dollar above Friday’s closing price.
Summing up, the immediate-term outlook is unclear, and while we may see additional strength this week, a big decline is still likely to follow. Therefore, it seems best to stay out of the market for now, but at the same time be prepared to take on a new (probably short) position shortly.
Trading position (short-term; our opinion): No positions are justified from the risk/reward perspective. We will keep you – our subscribers – informed should anything change.
Thank you.
Nadia Simmons
Forex & Oil Trading Strategist
Przemyslaw Radomski, CFA
Founder, Editor-in-chief, Gold & Silver Fund Manager
Gold & Silver Trading Alerts
Forex Trading Alerts
Oil Investment Updates
Oil Trading Alerts

