

Trading position (short-term; our opinion): Short positions with a stop-loss order at $74.06 and the initial downside target at $56.50 are justified from the risk/reward perspective.
Crude oil moved lower in the last few days, just as it was likely to and generated quick profits for those who followed our trade. However, it reached its support level and bounced from it on huge volume and some may say that the decline is already over. But is this really the case?
The odds are that it’s not. The candlestick patterns usually have very short-term implications (in terms of the timeframe that is used to create them) and yesterday’s reversal might have already worked and resulted in today’s move higher. Therefore, nothing else can happen based on it. We have, however, two important indications that remain in play.
Just as daily reversals have implications for days, weekly reversals have implications for weeks and monthly reversals have implications for month. The key thing to keep in mind is that we have a bearish weekly reversal in play this week and if it plays out correctly and crude oil ends the week in the red, then we’ll also have a powerful monthly reversal. The implications extend well beyond the next few days. Let’s take a closer look at the charts for details.
In the previous alert, we wrote the following:
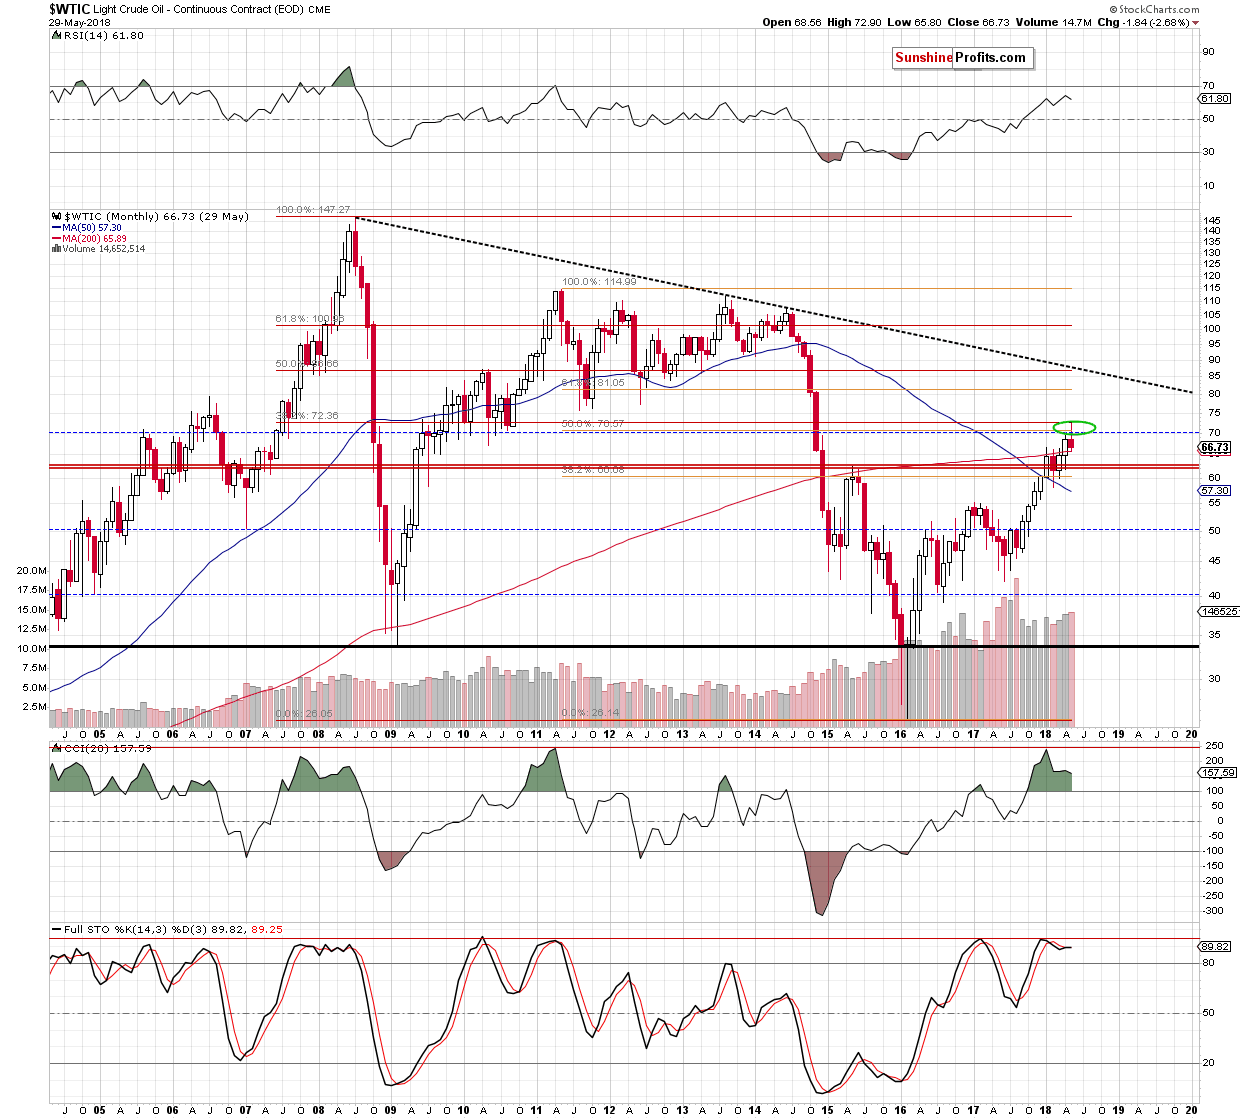
On the above chart we see that the price of crude oil has recently reached an important, long-term resistance area that we had marked with the green area in the previous analyses. It’s based on two important resistance levels. The first is the 50% Fibonacci retracement based on the 2011-2016 downward move and the second one is the 38.2% Fibonacci retracement based on the entire 2008-2016 decline.
Since the above-mentioned resistance levels were breached temporarily and both breakouts were invalidated (crude oil is below the 50% retracement at the moment of writing these words), the implications for the following weeks appear bearish. The confirmations that we meant previously, come mostly from the short-term charts though.
(…) we would like to add that at this time, May is already a down month for crude oil and – in light of today’s decline – it seems likely that it will end the month in the red. The implications would be very bearish for the following weeks as that would mean that we’ll going to see a monthly shooting star reversal candlestick.
The month is not over, but it’s quite close to be over, so it already makes sense to discuss the above.
Now, a lot could still change as we have about two and a half sessions before the end of the month, but since the previous week was a clear bearish reversal, it’s likely that crude oil will decline this week.
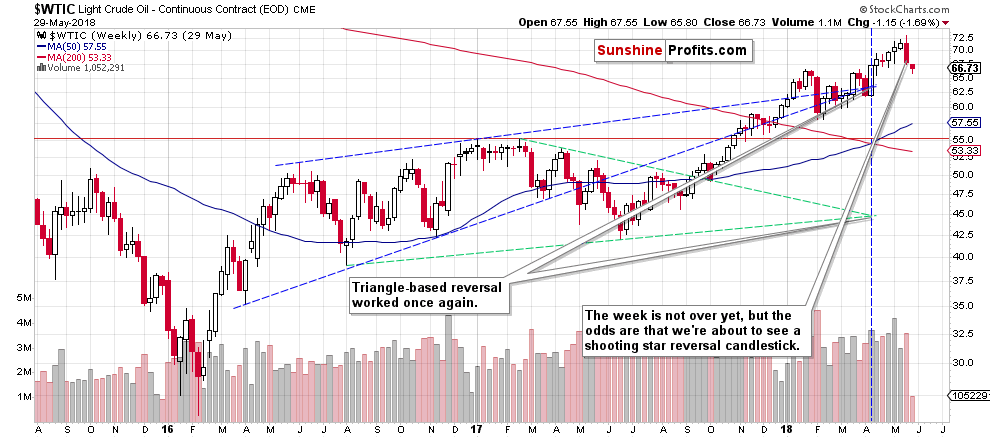
The volume confirms last week’s bearish candlestick, which further adds to the bearish case.
In yesterday’s alert, we wrote the following:
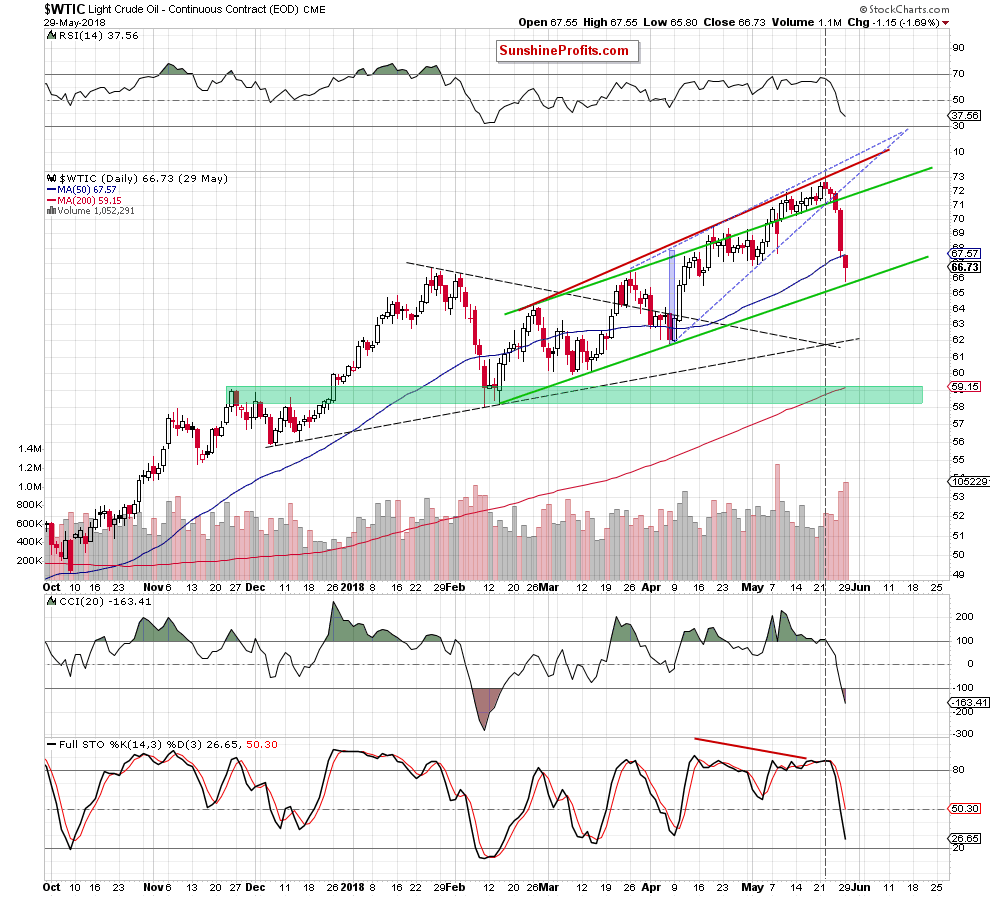
On the short-term chart, we see that crude oil declined substantially on huge volume. What we don’t see is that the decline continues also today – at the moment of writing these words, crude oil is trading at about $67. The breakdown below the rising wedge pattern and below the upper border of the green channel resulted in an additional decline, just like it was likely to. Moreover, since the top took place right at the triangle-apex-based reversal the entire move was believable.
Now, the question is where does crude oil go from here, as what was about to happen based on the reversal, seems to have happened. Precisely, the reversal doesn’t inform us how low the price is going to go, only that the trend is about to reverse.
In short, the price of any given asset is likely to move in a given direction until it reaches either a reasonable support or resistance. Crude oil is declining, so it is a meaningful support that we should focus on. In case of crude oil, the nearest one is created by the lower border of the rising trend channel (marked with green). It’s currently at about $65.70, so the price of black gold is likely to move at least to this level. Still, it doesn’t seem very likely that the entire downswing will end at that price. After all, we have just seen a major weekly reversal and are likely to see a monthly reversal shortly. These are both signs pointing to lower crude oil prices in the upcoming weeks, not just days.
In short, the above remains up-to-date, as the price of black gold did practically exactly as we had indicated. It moved to the rising green support line and bounced back. Also, based on the factors that we discussed earlier today, it doesn’t seem that the decline is completely over yet.
Summing up, the outlook for the crude oil remains bearish and it seems that we’ll see even lower prices in the coming weeks. In other words, it seems that the profits from the current short position will increase further.
Trading position (short-term; our opinion): Short positions with a stop-loss order at $74.06 and the initial downside target at $56.50 are justified from the risk/reward perspective. As always, we’ll keep you - our subscribers - informed should anything change, or should we see a confirmation/invalidation of the above.
Thank you.
Nadia Simmons
Forex & Oil Trading Strategist
Przemyslaw Radomski, CFA
Founder, Editor-in-chief, Gold & Silver Fund Manager
Gold & Silver Trading Alerts
Forex Trading Alerts
Oil Investment Updates
Oil Trading Alerts

