

Trading position (short-term; our opinion): No position in crude oil is justified from the risk/reward perspective.
Crude oil is rising and appears primed for a run. After all, commodities have had a good run in 2019 so far – just look at gold or silver. Talking these, what can we learn from a closer look at the currents under the surface? Come and join us for today's analysis.
Let’s start with the charts below to find out (charts courtesy of http://stockcharts.com).
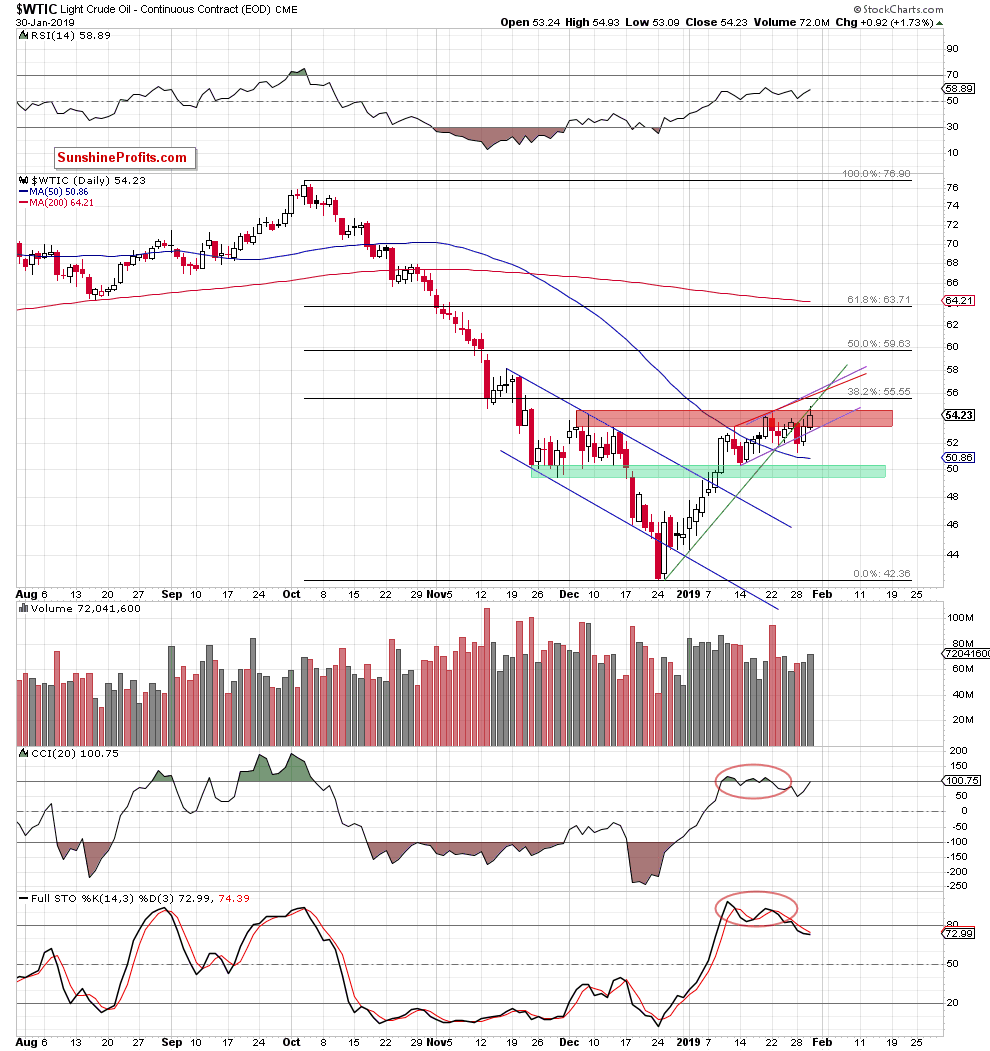
Looking at the daily chart, we see that crude oil broke above December peaks and hit a fresh January high. Volume supporting the move was neither too high, nor too low – it is definitely a positive sign that it was not waning. Decreasing volume during uptrends would point to exhaustion of buyers and it is not the case looking at yesterday.
Is it a bullish sign? Yes, but in our opinion only at the first sight. There are several points to pay attention to:
- the breakout above the December highs and 2019 peak was quickly invalidated
- the tiny breakout above the green support line (based on December and January lows) was also invalidated and looks like being verified today again
- the upswing hasn't even reached the 38.2% Fibonacci retracement
- sell signals by the daily indicators remain on the cards
- implications from the crude oil – gold and - silver ratios
USD Index dropped significantly yesterday (we discuss it in detail in today’s Forex Trading Alert) and precious metals reached fresh peaks. We will show you now what it means in the relationship between crude oil and both silver and gold.
Crude Oil – Gold Link – Divergence at First Sight

From this perspective, we see that a very strong correlation between the ratio and the price of black gold remains on the cards for many months.
However, we noticed something interesting, which can translate into another profitable opportunity similar to us riding the downtrend since the topping process in early October. Back then, we as opened the short on Oct 5th and partially closed it on Oct 12th to capture almost $5 dollars of the move – and got out later with the rest for even more. Our subscribers were prepared. What do we mean by interesting?
Analyzing the charts, we discovered that although both crude oil and gold hit fresh January highs during their recent sessions, the same was not true in the case of the oil-gold ratio. Why should we care?
It is a clear bearish divergence as crude oil is making a local high and gold even more so, yet the ratio doesn't follow. And it is important because gold and oil are so strongly positively correlated. Therefore, the odds are that oil will follow the ratio down as the ratio is not making a new high while oil is.
Additionally, when we compare the daily chart of crude oil and the ratio, we clearly see that the latter is much lower in relation to the 38.2% Fibonacci retracement and December peaks than the price of the commodity itself, which we can read as another bearish signal.
On top of that, when we focus on the weekly chart of our oil-gold ratio, we see that it didn’t even manage to break above the 200-week moving average in recent weeks.
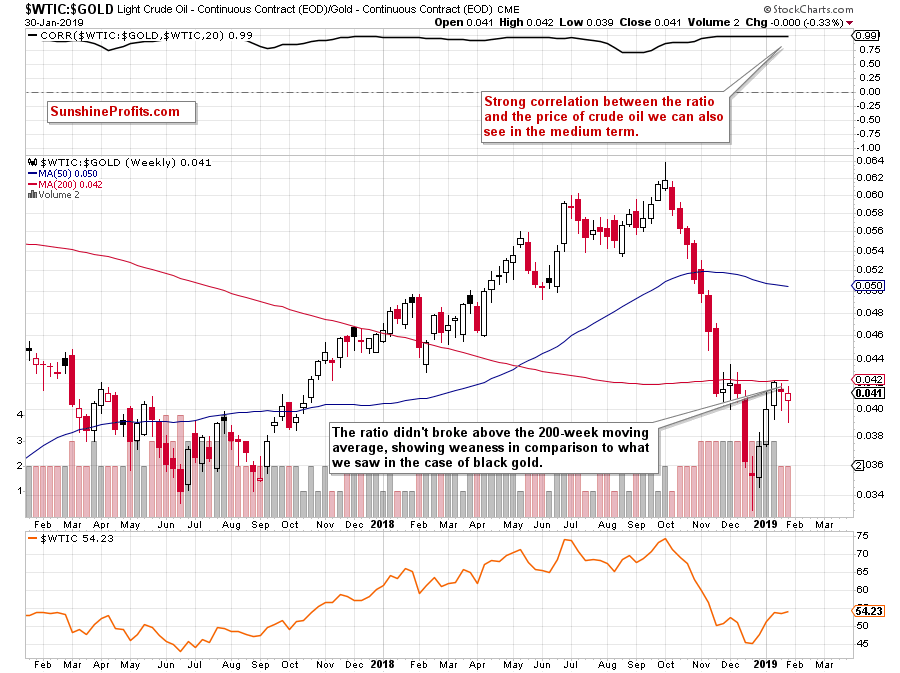
Such price action is an additional bearish factor, which increases the probability of oil price reversal from the current levels in the very near future.
We always want many factors pointing in the same direction to maximize odds in our favor. This is what prudent trading is about – the patience to wait for when the opportunity presents itself.
Will the analysis of oil-silver ratio add further bearish arguments?
Crude Oil – Silver – Another Divergence in Plain Sight
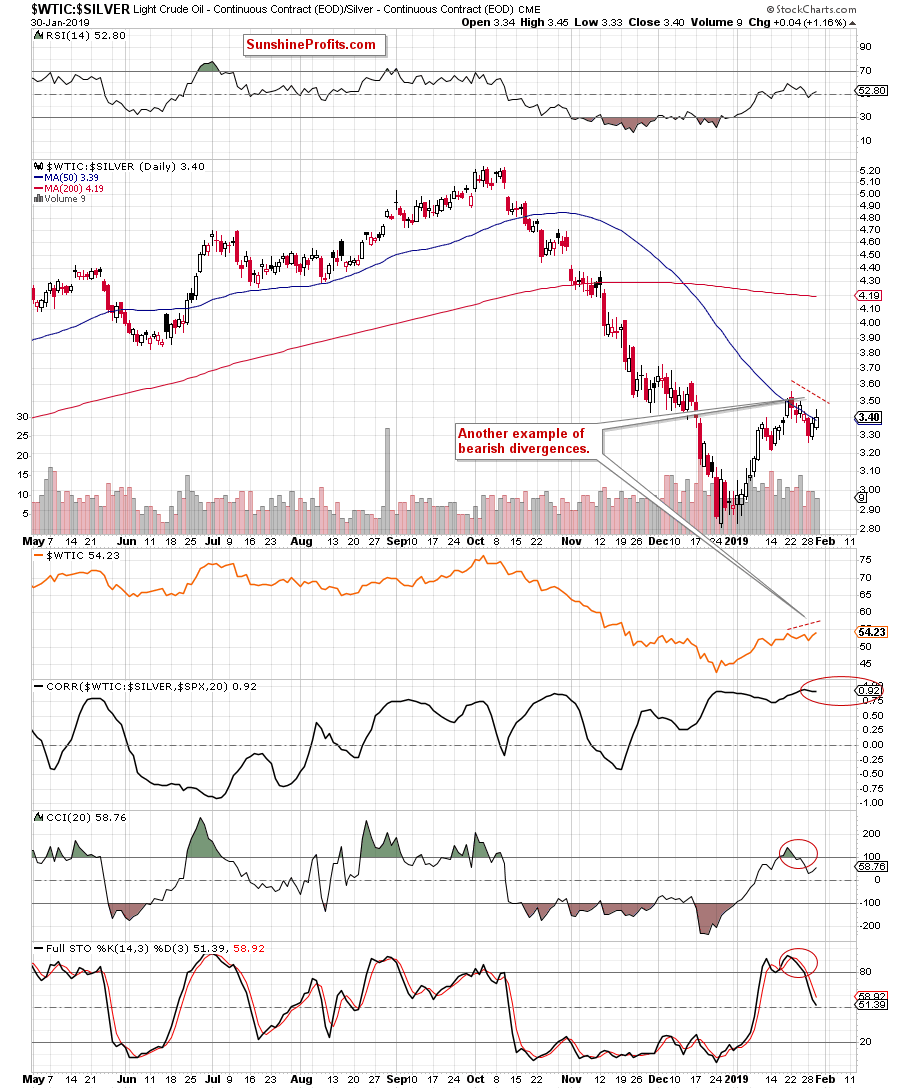
Wash, rinse, repeat. Again, the bearish divergence between the ratio and black gold price is the first thing that catches the eye on the daily chart.
It's not only that. We see one more sign of weakness, this time in the ratio itself. Take a look at the 50-day moving average. From today’s point of view, we see that the ratio broke above it only yesterday while the oil did that in the middle of the month already. This emphasizes the weakness of the ratio in relation to the price of the commodity itself. Remember that the ratios are leading indicators – the same relationship exists in the gold market itself between gold price and gold miners' price. You can exploit this and many other tools in our Gold Trading Alerts.
That's all very fine but what does it all mean for us in practice?
As we mentioned earlier, there is a very strong correlation between crude oil and the oil-to-gold ratio. We can observe the same in the case of the oil-to-silver ratio. This means that if the ratios move lower in the very near future, there is a high probability that the price of light crude will do the same – just like it did many times in the past.
Therefore, keeping an eye on their behavior may be a good confirmation of the decision to open short positions in crude oil in the very near future (maybe even later in the day).
Summing up, crude oil hit a fresh January peak and approached the 38.2% Fibonacci retracement. Although this is a bullish development, we haven’t seen a corresponding price action in its leading ratios, which may translate into a reversal soon.
Trading position (short-term; our opinion): No position in crude oil is justified from the risk/reward perspective. We will keep you informed should anything change, or should we see a confirmation/invalidation of the above.
Thank you.
Nadia Simmons
Forex & Oil Trading Strategist
Przemyslaw Radomski, CFA
Editor-in-chief, Gold & Silver Fund Manager

