

Trading position (short-term; our opinion): Long positions (with a stop-loss order at $40.40 and the upside target around $50).
Crude oil soared for the first time in 6 weeks and the rally continued on Monday – is it high time for the black gold to end its rally or at least take a breather?
In short, it seems that we’re getting close to such price levels, but we’re not yet at them.
Crude Oil’s Technical Picture
Let’s take a closer look at the charts (charts courtesy of http://stockcharts.com).
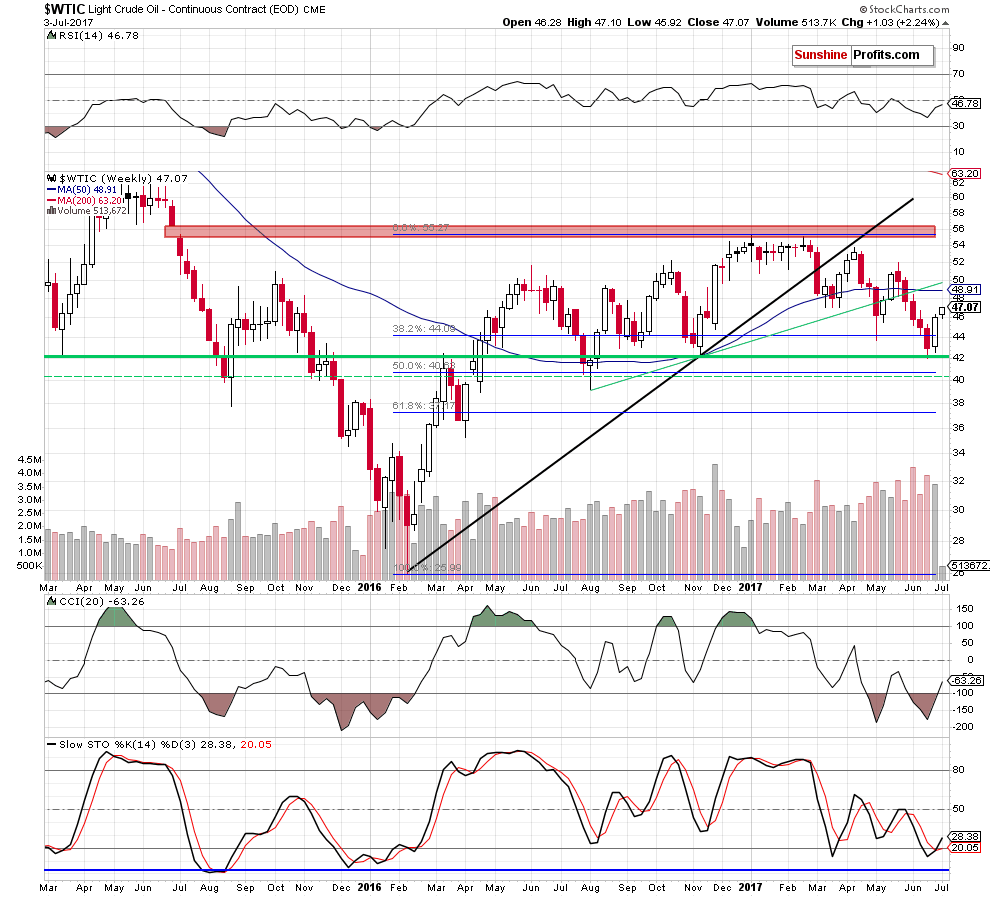
The above long-term chart featured 3 particularly important features.
The first one is the rising green resistance line based on the 2016 lows. It’s currently at about $50 and this is one of the things that make this level a quite likely price target for the current decline (other factors are more visible on the short-term chart).
The other two features are buy signals that come from the indicators: the CCI and the Stochastic. The CCI moved above the -100 level and the Stochastic moved above both the 20 level and its red signal line. Both developments quite often accompanied local bottoms. These signals don’t point to a specific price target, but they do confirm that the current move is likely up, as once these signals were indeed seen, the rally in crude oil – and the indicators themselves – was bigger than what we’ve seen so far.
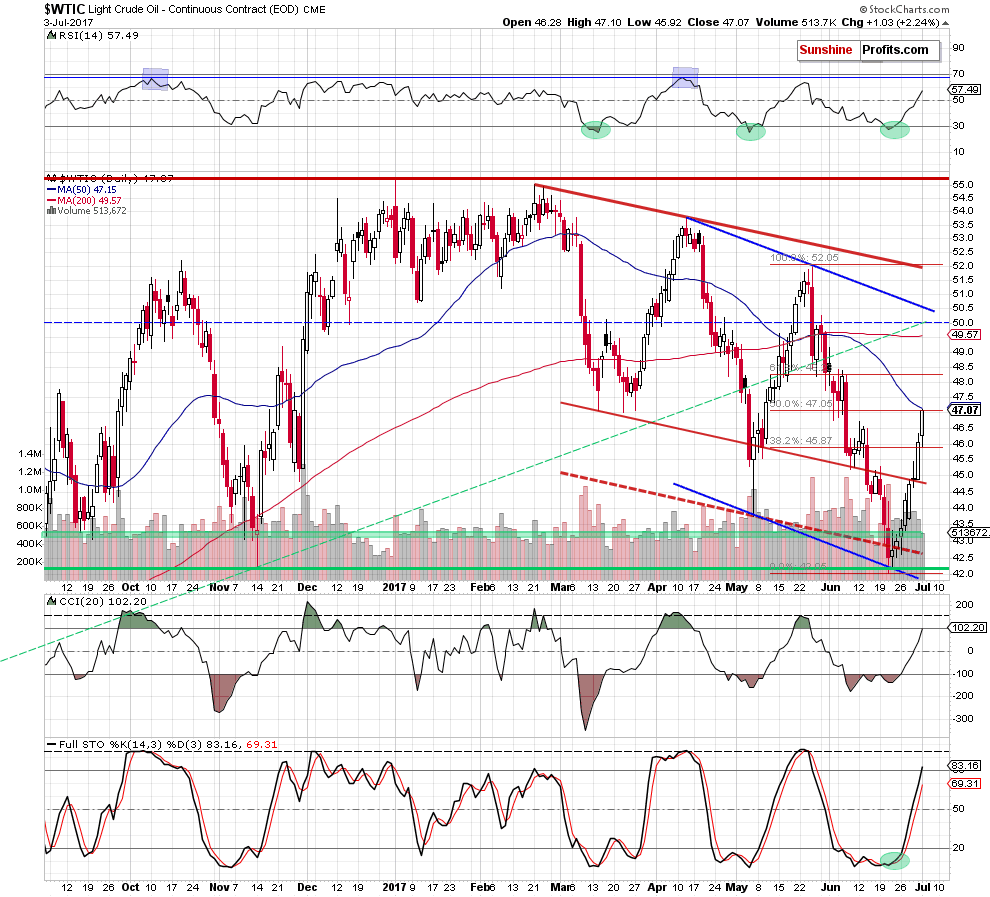
On a short-term basis, we see the same indicators based on the daily prices (the previous chart is based on weekly candlesticks) are well after the buy signals and that they have not reached their usual targets just yet. We marked these levels with horizontal, dashed lines – in most cases, the rallies continued until the indicators reached them.
The same goes for the RSI indicator – it’s not yet close to the 70 level, which suggests that the rally is likely not over yet.
As far as the price is concerned, we see that crude oil encountered a double resistance level (50% Fibonacci retracement and the 50-day moving average), but it doesn’t seem it’s strong enough to stop the rally – in particular, this moving average didn’t work as a reliable support or resistance in the previous months, so it doesn’t seem likely that it would work this time.
Oil Price Targets
The next resistance levels and likely targets are created by the 61.8% Fibonacci retracement (at $48.23) and (approximately) the $50 level. The $50 level is a very round number, so it’s important from the psychological point of view and it has indeed stopped both rallies and declines in the previous months (we marked it with a blue, dashed line). Moreover, the rising green resistance line and the declining blue resistance line also coincide close to the $50 level.
Which of these levels will stop the rally? The $50 level seems more probable, but we are keeping our eyes opened for any signs of weakness – if we see bearish confirmations close to the 61.8% Fibonacci retracement (for instance a clear reversal candlestick on huge volume), we will likely close the current long position – the one that we had entered at the beginning of the session on June 27th - and take profits off the table even before the $50 level is reached). Still, for now, the short-term trend remains up.
Summing up, it seems that crude oil will move even higher before the next local top is seen.
Very short-term outlook: bullish
Short-term outlook: bullish
MT outlook: mixed
LT outlook: mixed
Trading position (short-term; our opinion): Long positions (with a stop-loss order at $40.40 and the upside target around $50) We will keep you informed should anything change, or should we see a confirmation/invalidation of the above.
Thank you.
Nadia Simmons
Forex & Oil Trading Strategist
Przemyslaw Radomski, CFA
Founder, Editor-in-chief, Gold & Silver Fund Manager
Gold & Silver Trading Alerts
Forex Trading Alerts
Oil Investment Updates
Oil Trading Alerts

