

Trading position (short-term; our opinion): No positions are justified from the risk/reward perspective.
On Friday, crude oil extended gains and broke above the January peak. How high could black gold go in the coming days?
Crude Oil’s Technical Picture
Let’s examine the technical picture of the commodity (charts courtesy of http://stockcharts.com).
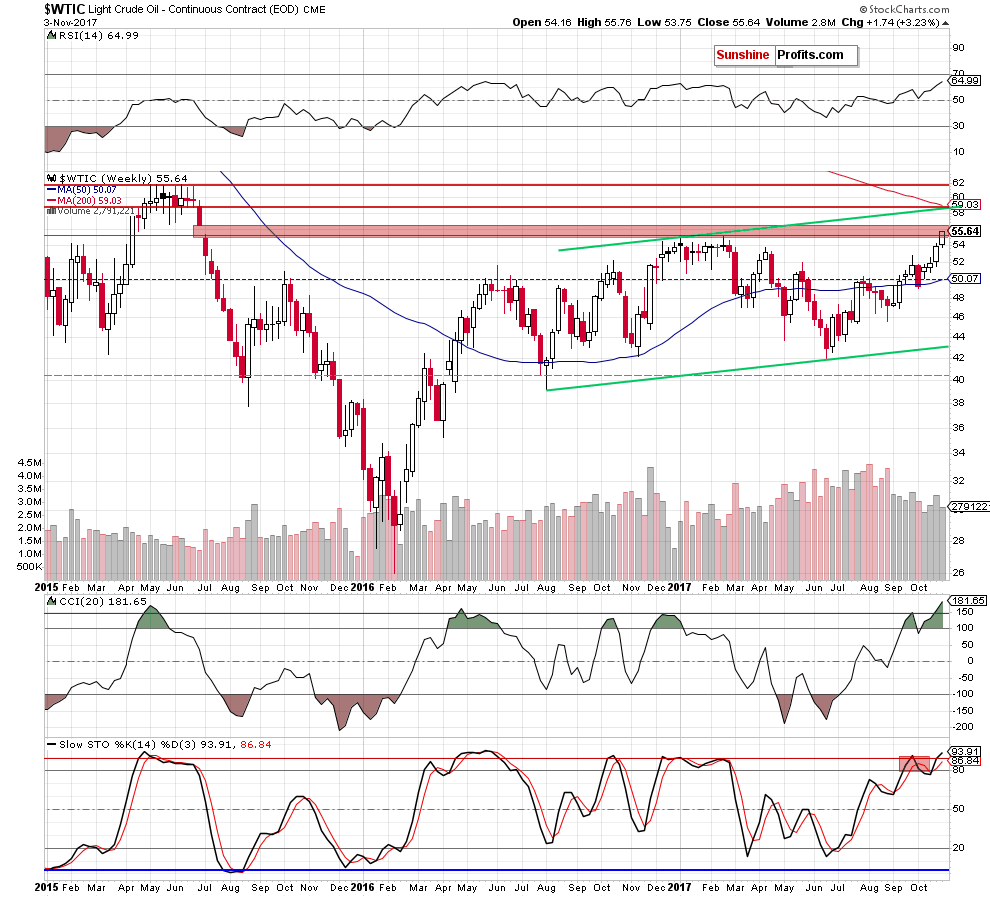
The first thing that catches the eye on the medium-term chart is the breakout above the early 2017 highs. Thanks to this increase crude oil climbed to the red zone created by the June-July gap, which serves as the nearest resistance at the moment.
Will we see further improvement? In our opinion, such price action will be likely only if the commodity closes the above mentioned gap (in other words, if we see daily closure above $56.50) in the coming week.
If we see such bullish development, oil bulls will likely push light crude to around $58.42-$59.03, where the upper border of the green rising trend channel and the 200-week moving average are at the moment of writing these words.
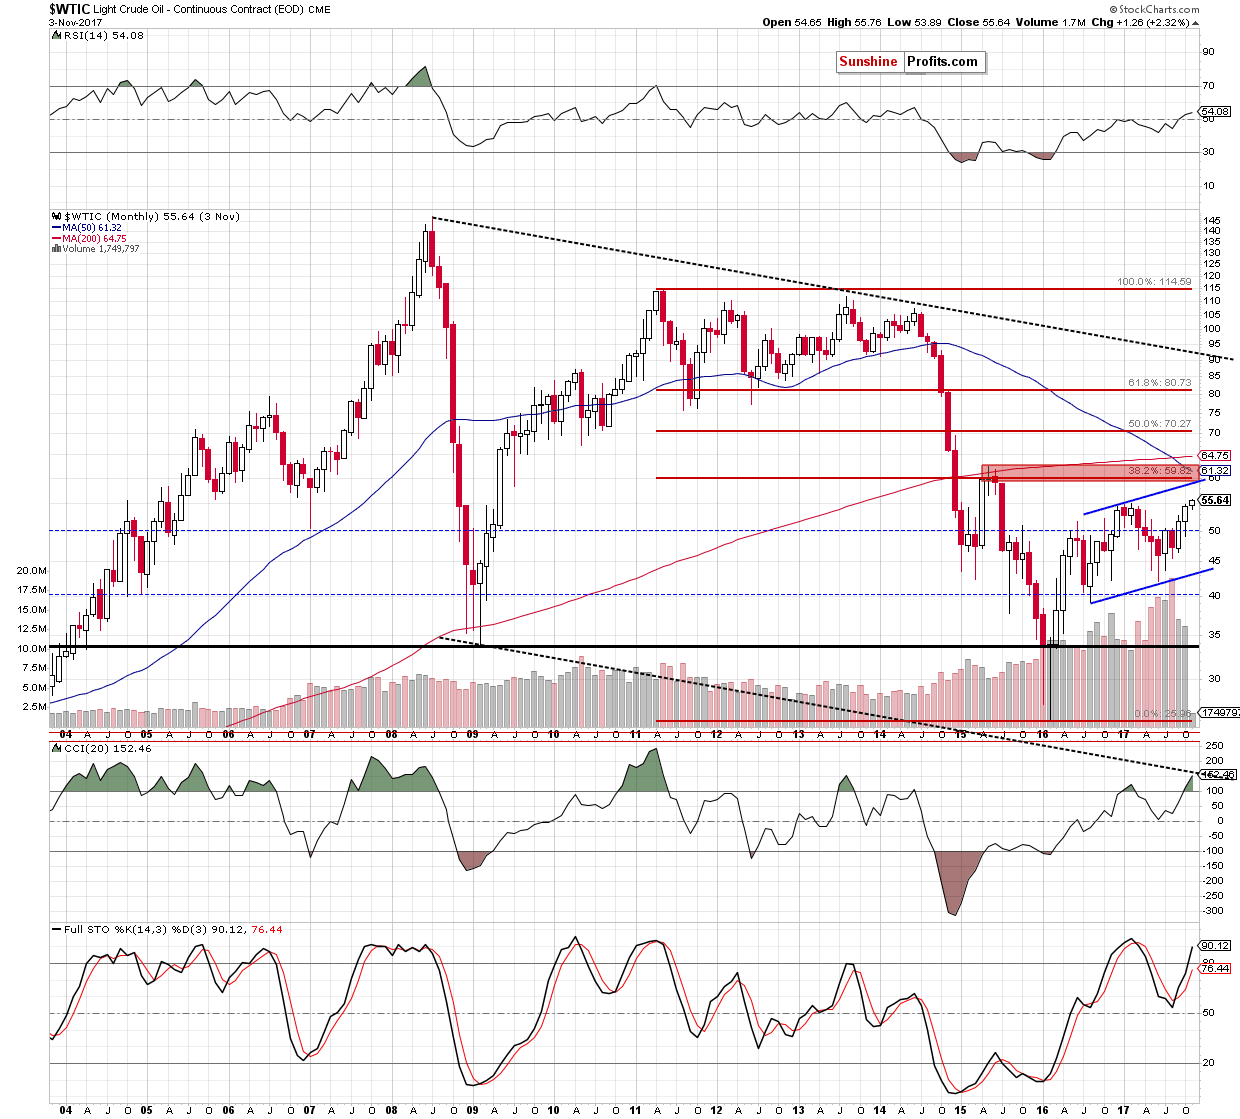
At this point it is worth noting that slightly above these levels is also the next important resistance zone created by the May, June, July peaks and the 38.2% Fibonacci retracement (seen more clearly on the long-term chart below).
Summing up, crude oil hit fresh 2017 highs, which suggests a test of the next resistance area in the coming days. Nevertheless, such price action will be more likely if black gold closes the red gap seen on the weekly chart.
Very short-term outlook: mixed with bullish bias
Short-term outlook: mixed with bullish bias
MT outlook: mixed
LT outlook: mixed
Trading position (short-term; our opinion): No positions are justified from the risk/reward perspective. We will keep you – our subscribers – informed should anything change.
Thank you.
Nadia Simmons
Forex & Oil Trading Strategist
Przemyslaw Radomski, CFA
Founder, Editor-in-chief, Gold & Silver Fund Manager
Gold & Silver Trading Alerts
Forex Trading Alerts
Oil Investment Updates
Oil Trading Alerts

