

Trading position (short-term; our opinion): No positions are justified from the risk/reward perspective.
Although crude oil moved lower after the market’s open, oil bulls pushed the commodity higher, which resulted in a climb above the previously-broken support/resistance line. Will this event trigger further rally in the coming days?
Crude Oil’s Technical Picture
Let’s take a closer look at the charts and find out (charts courtesy of http://stockcharts.com).
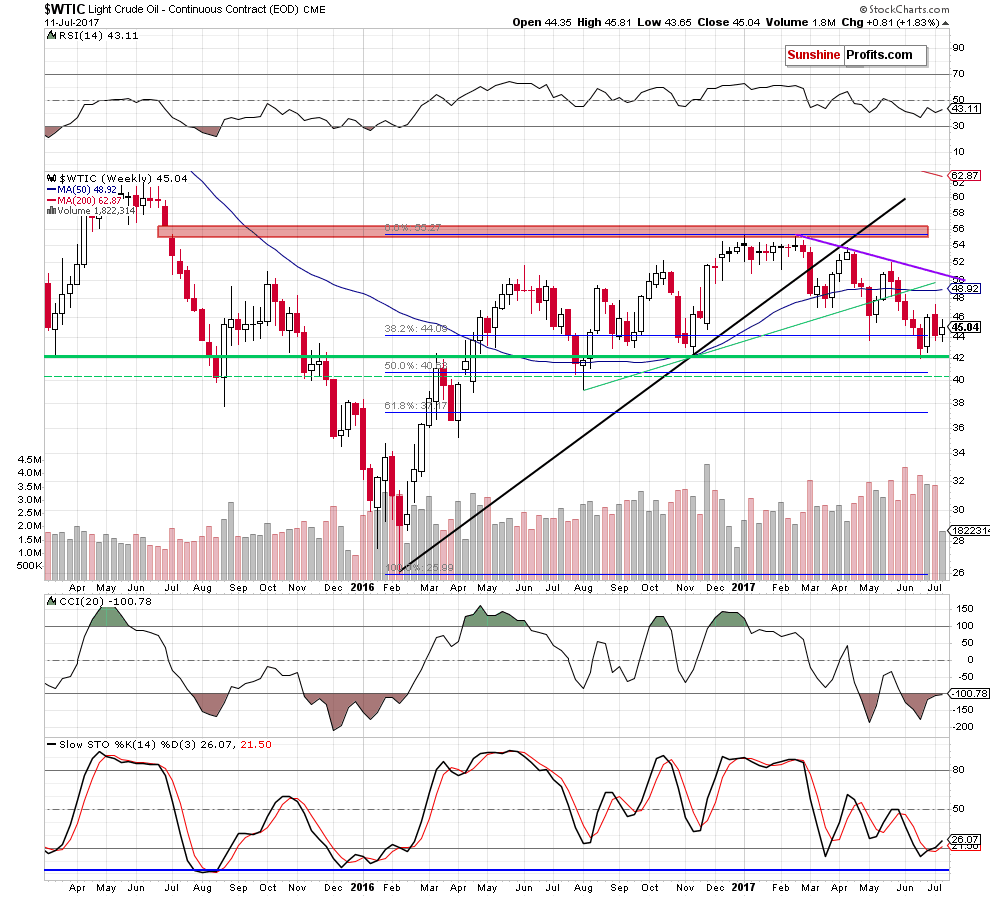
On the weekly chart, we see that although crude oil slipped slightly below the 38.2% Fibonacci retracement, this nearest support withstood the selling pressure and triggered a rebound.
How did this increase affect the very short-term picture? Let’s check.
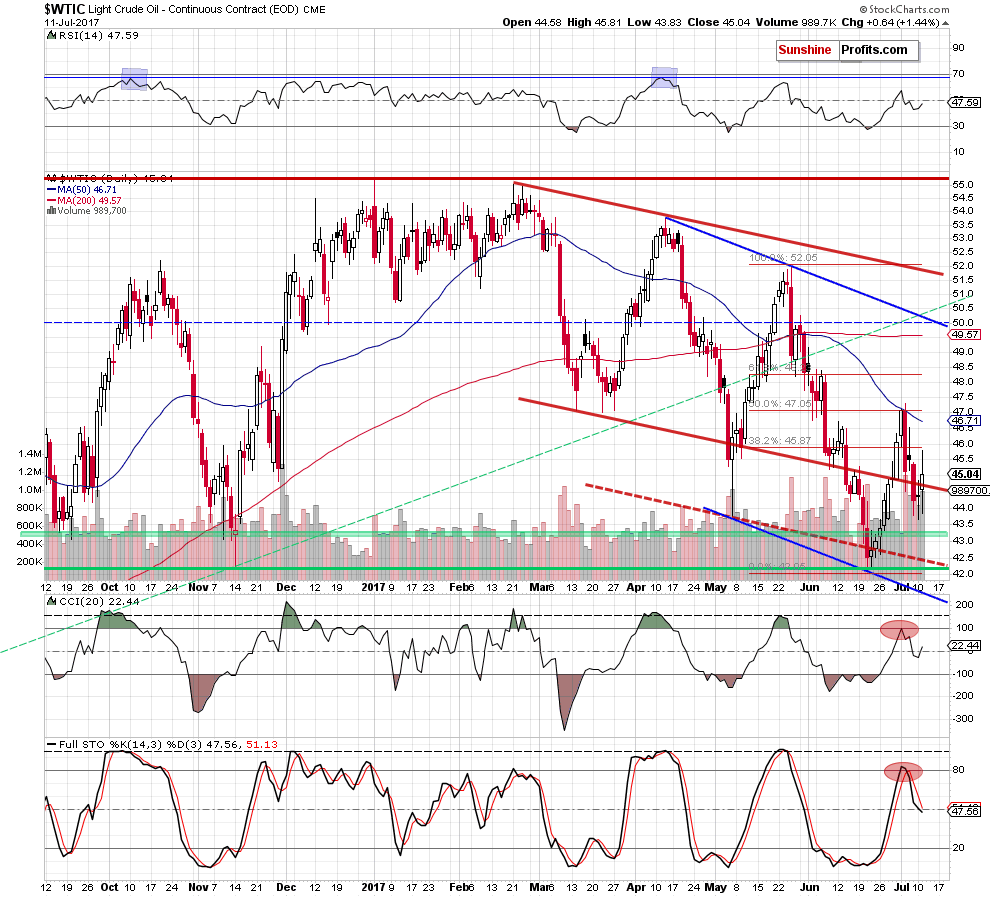
From today’s point of view, we see that although crude oil declined after the market’s open, the proximity to the recent lows encouraged oil bulls to act. As a result, light crude rebounded and came back above the previously-broken lower border of the red declining trend channel. In this way, the black gold invalidated the earlier breakdown, which is a positive development. Nevertheless, the sell signals generated by the CCI and the Stochastic Oscillator remain in place, suggesting another attempt to move lower.
Crude Oil – Gold Link
Additionally, when we take a look at the oil-to-gold ratio, we will see one more bearish factor.
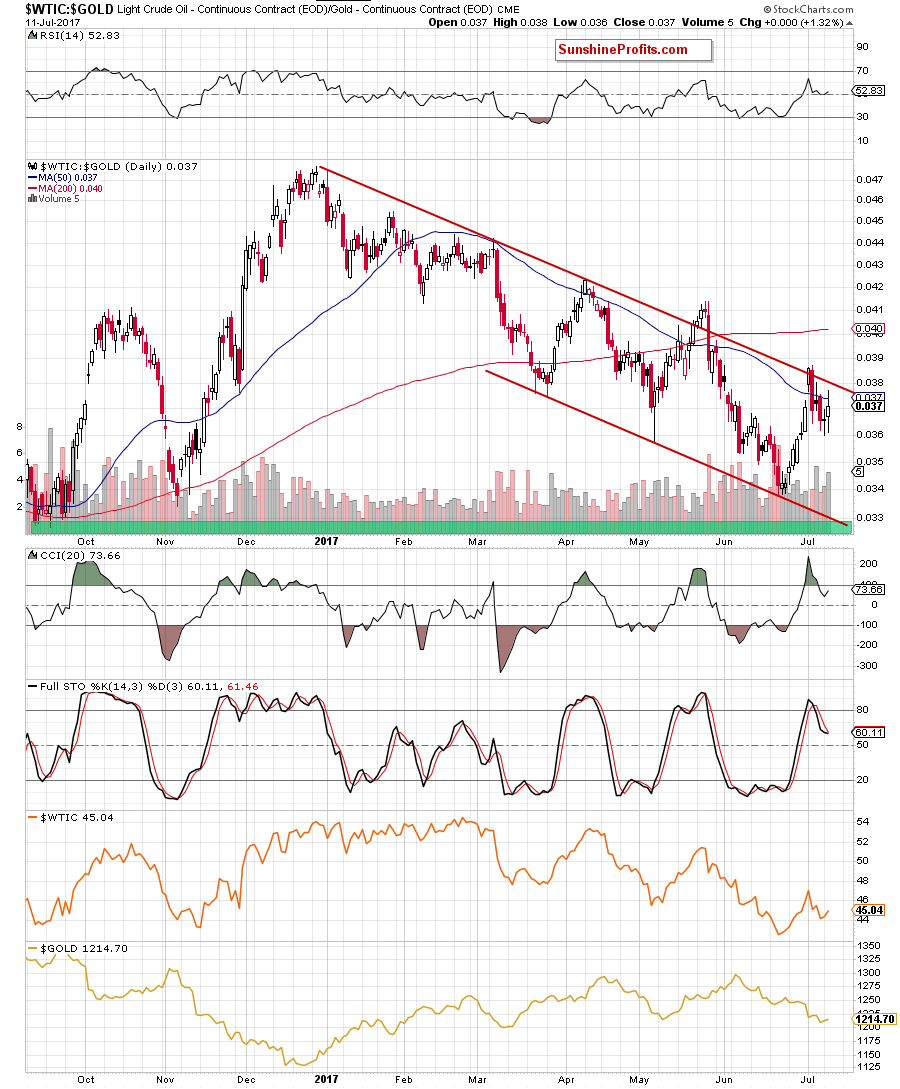
The first thing that caches the eye on the daily chart is an invalidation of the breakout above the upper border of the red declining trend channel. As you see, similar situation at the end of May triggered a sharp decline, which took the ratio and crude oil to fresh 2017 lows. Additionally, the CCI and the Stochastic Oscillator generated the sell signals, increasing the probability of further declines and a test of the recent lows or even the green support zone.
Yesterday the ratio moved a bit higher, but the 50-day moving average and the proximity to the upper border of the trend channel were enough to encourage the bears to act. Such price action suggests that as long as there is no confirmed breakout above the upper red resistance line another attempt to move lower is likely.
What does it mean for the price of crude oil? Taking into account the fact that positive correlation between the ratio and the commodity is still in cards, we believe that declines in the ratio will likely translate into lower prices of crude oil in the coming week(s) – similarly to what we saw in the past.
Summing up, crude oil came back above the previously-broken lower border of the red declining trend channel, but then pulled back a bit, which together with the sell signals generated by the indicators and the current situation in the oil-to-gold ratio suggests another downswing in the very near future.
Very short-term outlook: mixed with bearish bias
Short-term outlook: mixed with bearish bias
MT outlook: mixed
LT outlook: mixed
Trading position (short-term; our opinion): No positions are justified from the risk/reward perspective. We will keep you – our subscribers – informed should anything change.
Thank you.
Nadia Simmons
Forex & Oil Trading Strategist
Przemyslaw Radomski, CFA
Founder, Editor-in-chief, Gold & Silver Fund Manager
Gold & Silver Trading Alerts
Forex Trading Alerts
Oil Investment Updates
Oil Trading Alerts

