

Trading position (short-term; our opinion): Short positions with a stop-loss order at $70.11 and the initial downside target at $62.85 are justified from the risk/reward perspective.
Crude oil soared higher yesterday, breaking to new 2018 highs. But, amid this volatile and exciting action, something else also took place that will likely catch many investors by surprise.
Namely, while the price of crude oil broke higher in the USD terms, something quite different is taking place in case of the other currencies.
Technical Analysis of Crude Oil
Let's examine the charts below (charts courtesy of http://stockcharts.com).
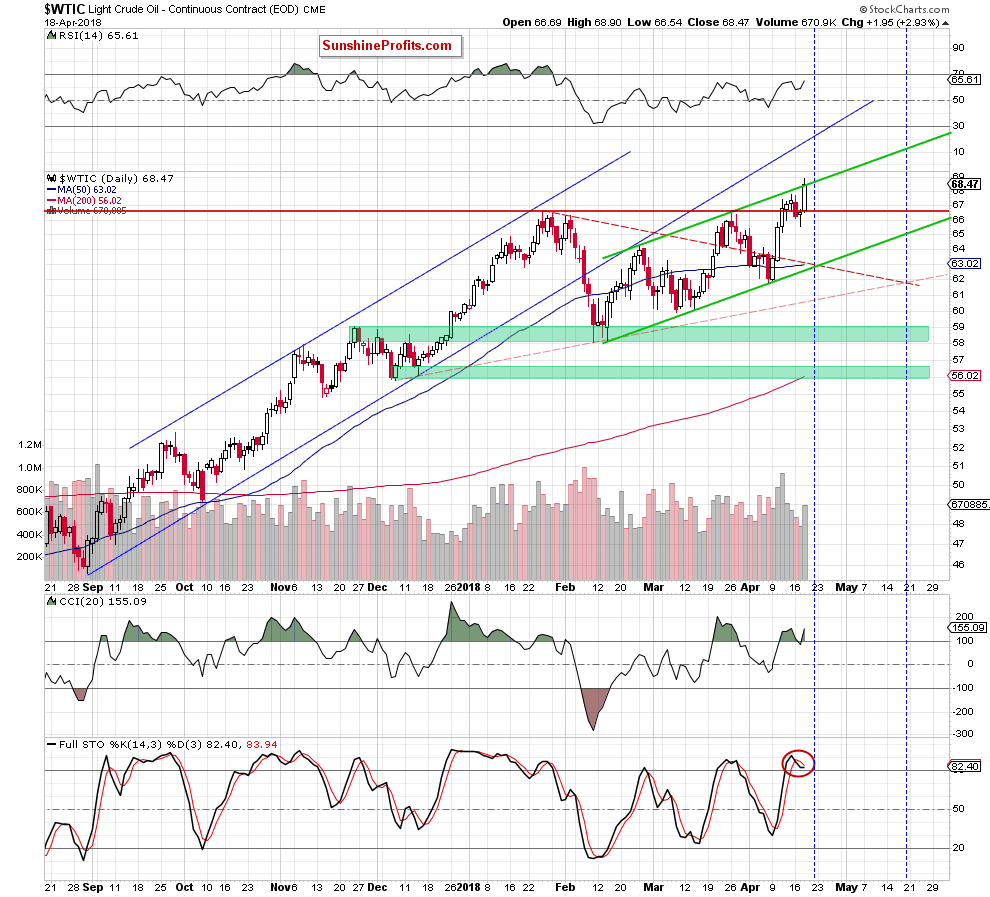
The first thing that catches the eye on the daily chart is a fresh 2018 high. But is this development as bullish as it seems at the first glance?
In our opinion, it’s not. Why? We find 3 important technical reasons for this assumption:
First, although light crude moved quite sharply higher and broke above the upper border of the green rising trend channel yesterday, oil bulls didn’t manage to hold gained levels which resulted in a pullback. Thanks to this price action the commodity slipped slightly below the above-mentioned resistance line, invalidating the earlier breakout.
Second, yesterday’s fresh peak materialized on higher volume compared to what we saw in previous days, but it was significantly lower than earlier this month, which raises some doubts about the strength of the recent rally.
Third, although the CCI came back above the level of 100, the sell signal generated by the Stochastic Oscillator remains in the cards, supporting oil bears and another attempt to move lower in the coming days.
Crude Oil from Non-USD Perspective
On top of that, the picture, which emerges from the non-USD (WTIC:UDN ratio) chart of crude oil also doesn’t bode well for oil bulls and higher prices. As a reminder, please note that UDN is the symbol for the PowerShares DB US Dollar Index Bearish Fund, which moves in the exact opposite direction to the USD Index. Since the USD Index is a weighted average of the dollar's exchange rates with world's most important currencies, the WTIC:UDN ratio displays the value of crude oil priced in "other currencies".
Let’s examine the weekly chart below.
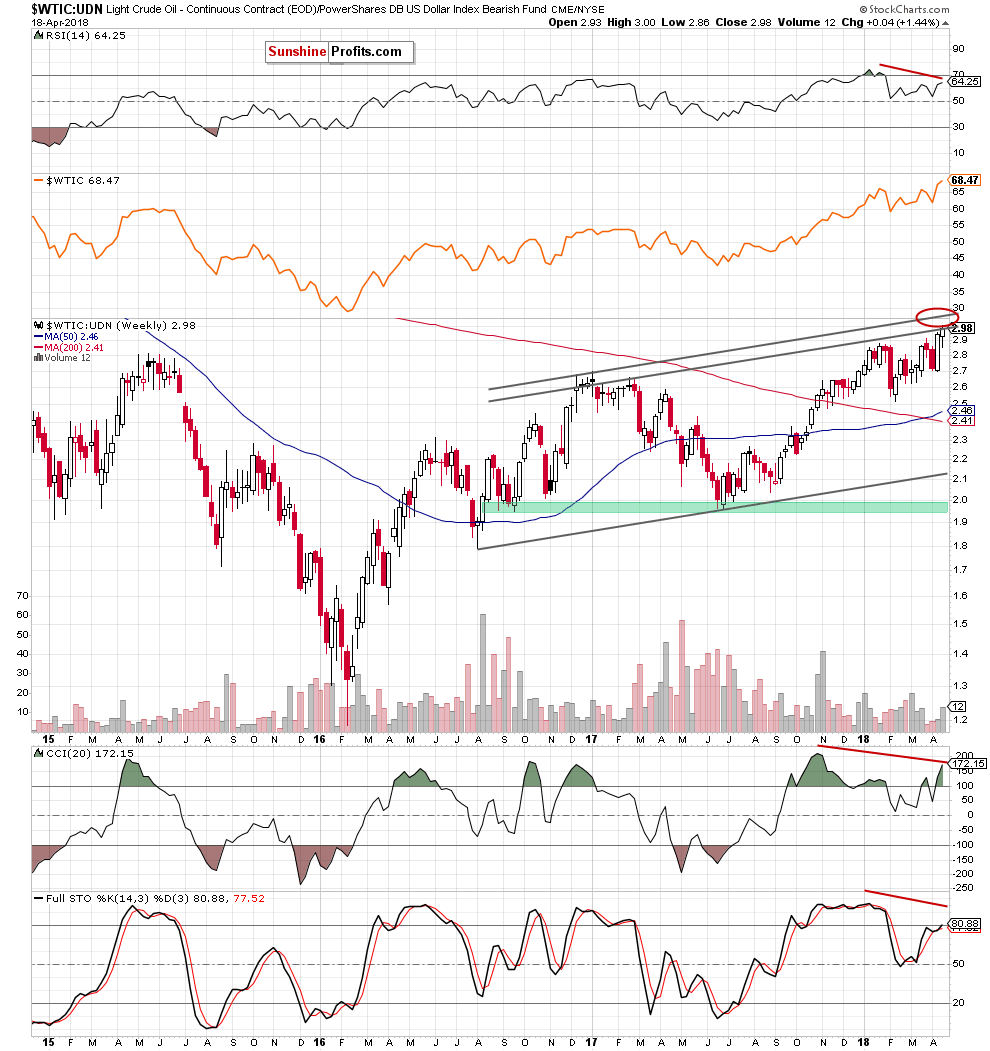
Looking at the above chart, we see that the ratio extended gains and climbed to the strong resistance area created by the upper borders of the black rising trend channel (based on an intraweek highs and closing prices), which suggests that the space for gains may be limited and reversal is just around the corner.
Additionally, these are clearly visible negative divergences between the ratio and the indicators, which increases the probability of a downswing in a very near future.
Summing up, although crude oil hit a fresh 2018 peak, the commodity closed the day inside the green rising trend channel, which suggests that as long as there is no confirmed breakout above the upper line of the formations another attempt to move lower is likely – especially when we factor in the current situation in the non-USD chart of crude oil.
Trading position (short-term; our opinion): Short positions (with a stop-loss order at $70.11 and the initial downside target at $62.85) are justified from the risk/reward perspective. We will keep you informed should anything change, or should we see a confirmation/invalidation of the above.
Thank you.
Nadia Simmons
Forex & Oil Trading Strategist
Przemyslaw Radomski, CFA
Founder, Editor-in-chief, Gold & Silver Fund Manager
Gold & Silver Trading Alerts
Forex Trading Alerts
Oil Investment Updates
Oil Trading Alerts

