

Trading position (short-term; our opinion): Short positions (with a stop-loss order at $54 and the initial downside target at $45.80) are justified from the risk/reward perspective.
Although the EIA showed that crude oil stocks dropped for the third-straight week, the report also showed that gasoline inventories and supplies at Cushing, Oklahoma, increased, making the overall situation a bit unclear. However, the commodity extended losses after the International Agency Energy affected negatively investors’ sentiment. Thanks to these circumstances, light crude lost 1.36% and closed another day under the resistance zone. Will it withstand the buying pressure in the coming week?
Yesterday, the U.S. Energy Information Administration showed that crude oil inventories fell by 2.75 million barrels, beating analysts’ forecasts of a decline of around 1.99 million barrels, while distillate inventories dropped by 1,5 million barrels in the week ended October 6. Despite these bullish numbers, the report also showed that gasoline inventories rose by 2.5 million barrels, missing expectations for a decline of 480,000 barrels and supplies at Cushing, Oklahoma, increased by 1.32 million barrels last week, making the overall picture of the inventories unclear.
Nevertheless, the situation worsened after the monthly update from the International Agency Energy, which suggested that global demand for oil could come under pressure in the coming year and demand for oil from OPEC would be around 150,000 bpd lower than the group pumped in September. Thanks to these circumstances, light crude extended looses and closed another day under the resistance zone. Will it withstand the buying pressure in the coming week?
Crude Oil’s Technical Picture
Let’s take a closer look at the charts below and try to find outy (charts courtesy of http://stockcharts.com).
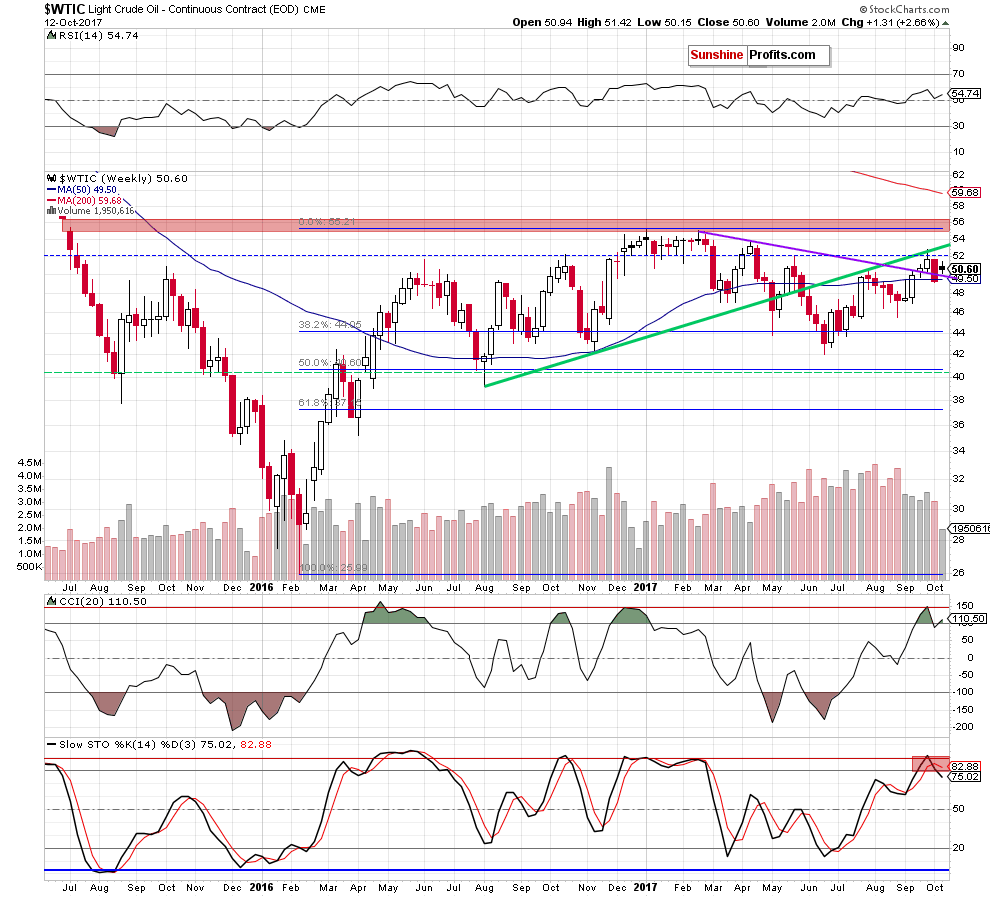
From today’s point of view, we see that the overall situation in the medium term hasn’t changed much as the long-term green resistance line continues to keep gains in check. Additionally, black gold is still trading under the May and September highs, which together with the sell signal generated by the Stochastic Oscillator (and the current position of the CCI) suggests that another move to the downside is just around the corner.
How the recent price action affected the long-term perspective? Let’s examine the monthly chart and find out.
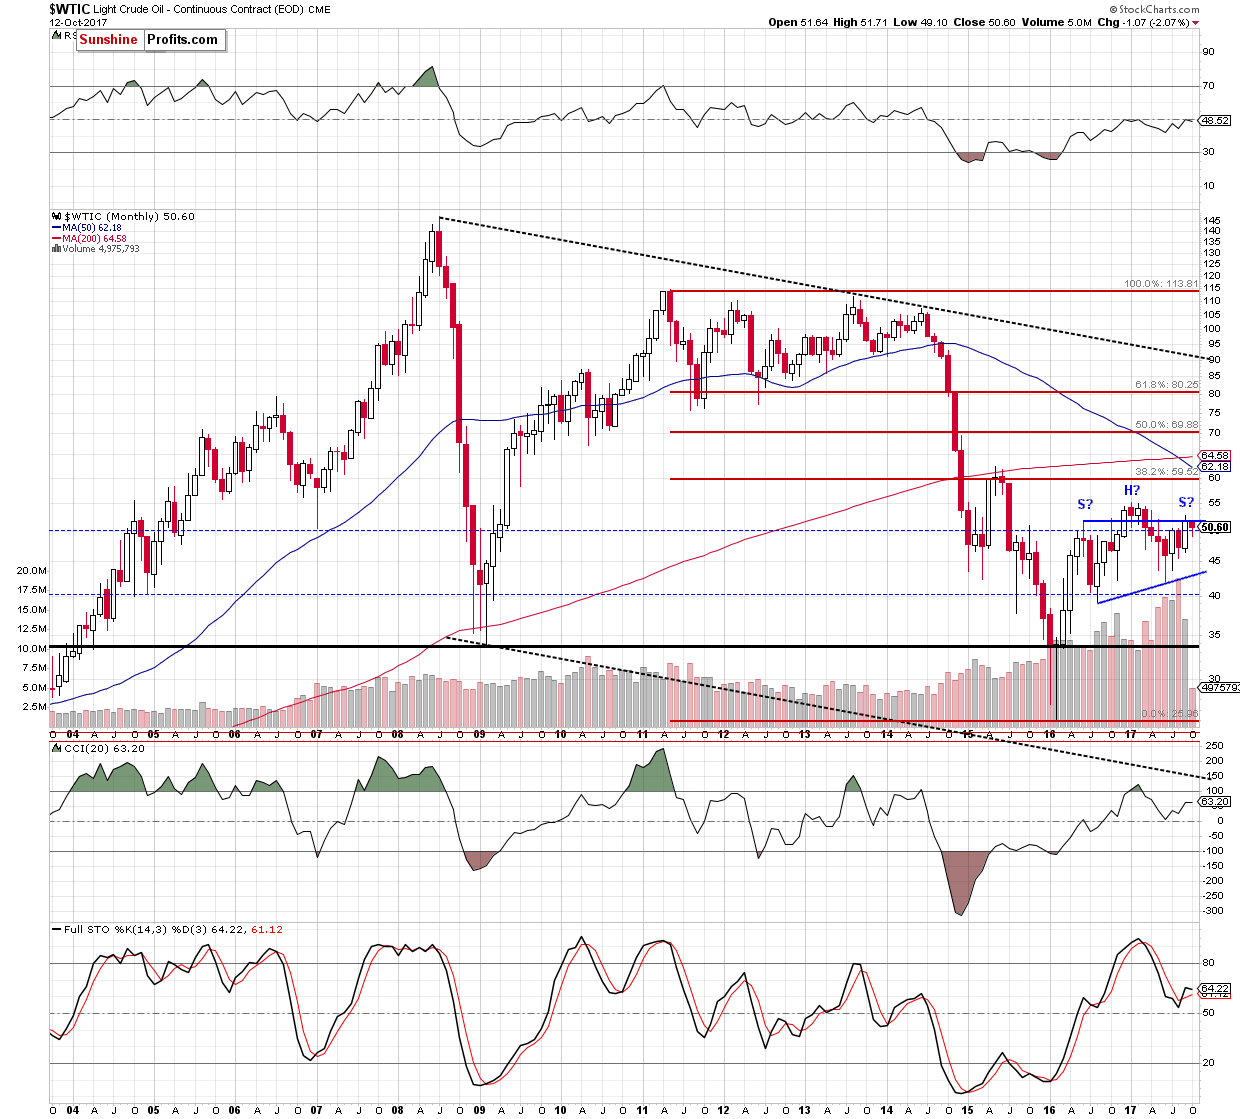
Looking at the monthly chart, we see that black gold remains under the blue line based on the potential left shoulder of the head and shoulders formation. Of course it will be more bearish and reliable only if crude oil falls below the neck line of the pattern (the blue support line based on the August 2016 and June 2017 lows around $43.20 at the moment of writing these words), but we think that oil bears will use all the above-mentioned resistances to create the right shoulder of the pattern in the following weeks.
Crude Oil - Precious Metals Link
Will the current situation in the oil-to-precious metals ratios confirm this pro bearish scenario? Let’s take a closer look at them and find out.
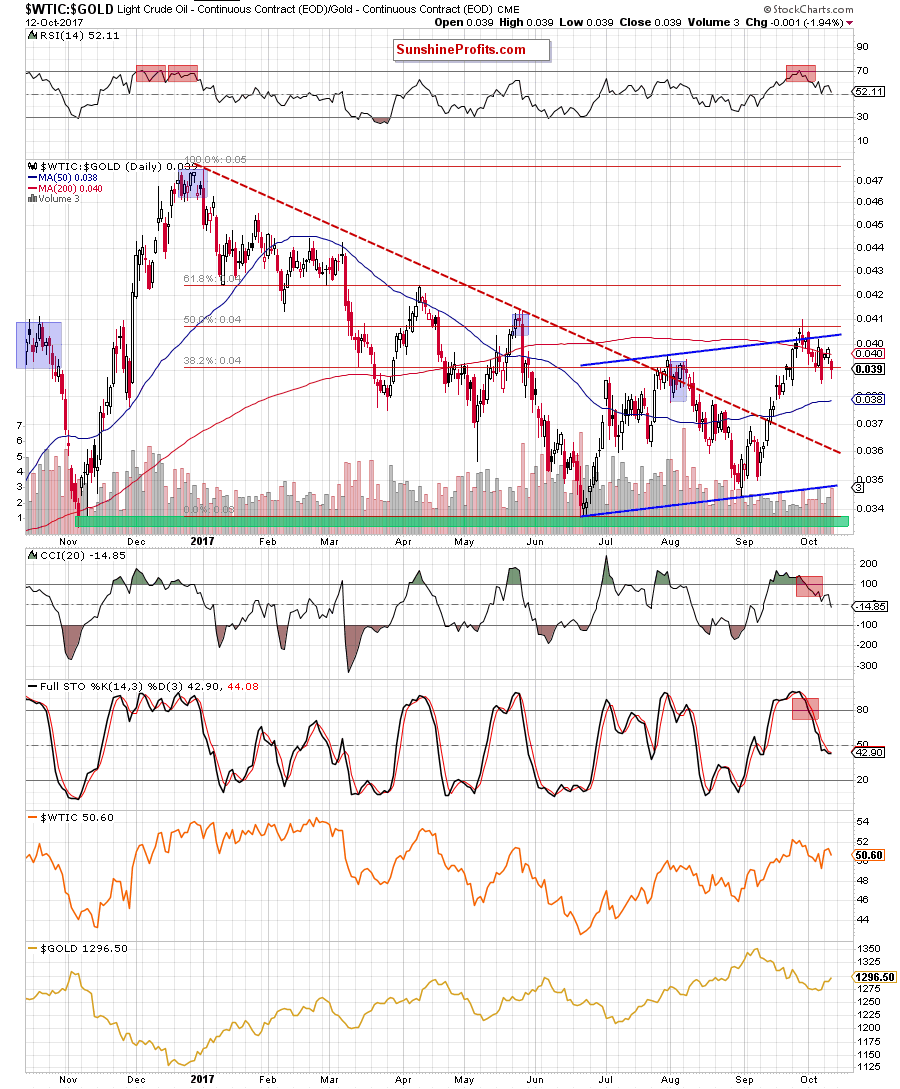
Looking at the daily chart of the oil-to-gold ratio, we see that despite recent increase, the ratio reversed and declined yesterday, closing the day below the 200-day moving average and the August highs. This means that the earlier invalidation of the breakout above the 50% Fibonacci retracement and the upper border of the blue rising trend channel and its negative impact on the ratio are still in effect.
Additionally, there are no buy signals, which could encourage bulls to act, which suggests further deterioration and increases the probability of lower values of the ratio and crude oil in the coming days.
This pro-bearish scenario is also reinforced by the current situation in the oil-to-silver ratio.
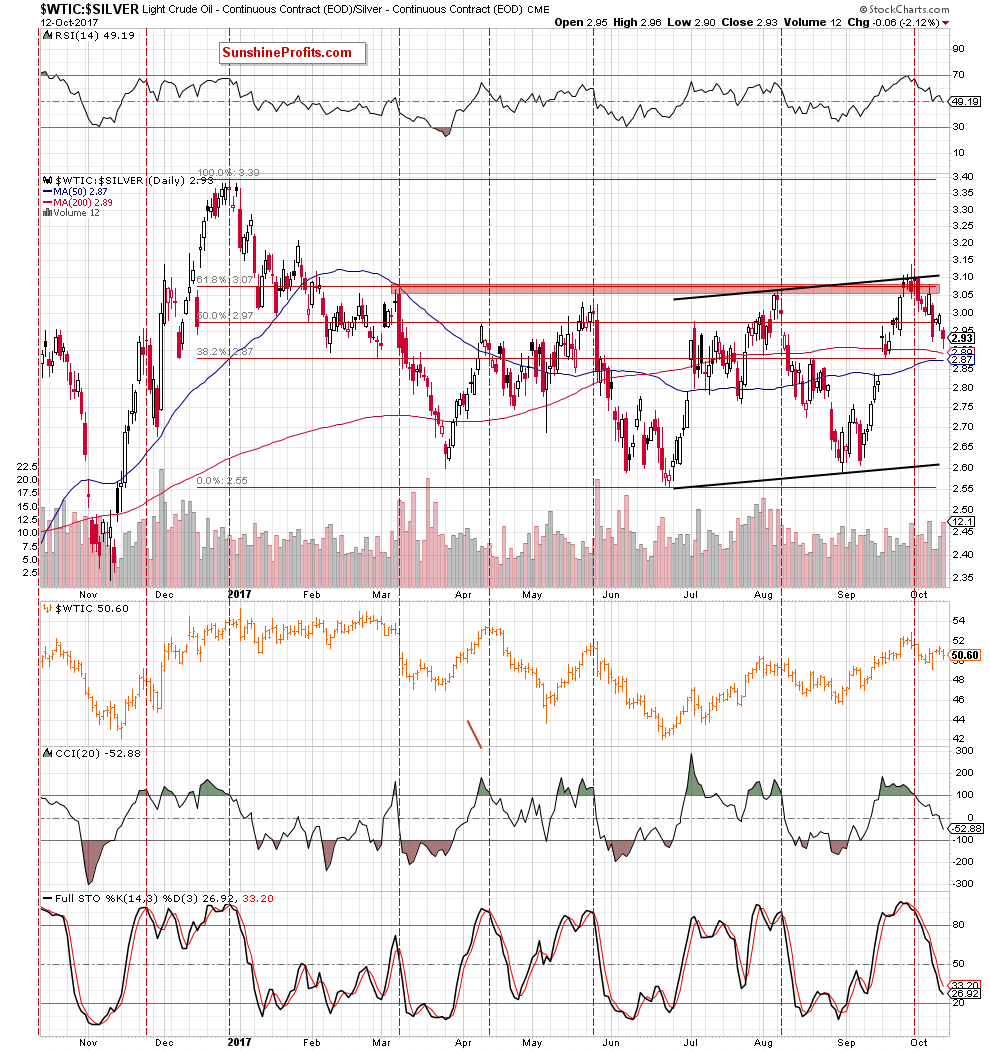
As you see on the above chart, the ratio not only erased the recent rebound, but also hit a fresh October low yesterday, which together with an invalidation of the earlier tiny breakout above the red resistance zone, the 61.8% Fibonacci retracement and the upper border of the black rising trend channel and the sell signals generated by the indicators continue to support bears and lower values of the ratio.
What does it mean for crude oil? Just like we wrote in the case of the oil-to-gold ratio, we believe that further deterioration in the ratio will encourage oil bears to act and bring lower prices of black gold in the coming weeks.
Summing up, short positions continue to be justified from the risk/reward perspective as crude oil remains under the resistance area created by the May and August highs and the long-term green resistance line, which stopped oil bulls at the end of July and also at the end of the previous month. The pro bearish scenario is also reinforced by the current situation in the oil-to-gold and oil-to-silver ratios, which suggests that lower prices of crude oil are just ahead of us.
Very short-term outlook: bearish
Short-term outlook: mixed with bearish bias
MT outlook: mixed
LT outlook: mixed
Trading position (short-term; our opinion): Short positions (with a stop-loss order at $54 and the initial downside target at $45.80) are justified from the risk/reward perspective. We will keep you – our subscribers – informed should anything change.
Thank you.
Nadia Simmons
Forex & Oil Trading Strategist
Przemyslaw Radomski, CFA
Founder, Editor-in-chief, Gold & Silver Fund Manager
Gold & Silver Trading Alerts
Forex Trading Alerts
Oil Investment Updates
Oil Trading Alerts

