

Trading position (short-term; our opinion): No positions are justified from the risk/reward perspective.
Although crude oil hit a fresh 2018 high oil bears didn’t let their opponents to push the price of black gold significantly higher yesterday. As a result, the commodity pulled back and closed the day slightly above the January peak. Is this a verification of the breakout or first signal of upcoming bulls’ problems?
Technical Analysis of Crude Oil
Let's examine the charts below (charts courtesy of http://stockcharts.com).
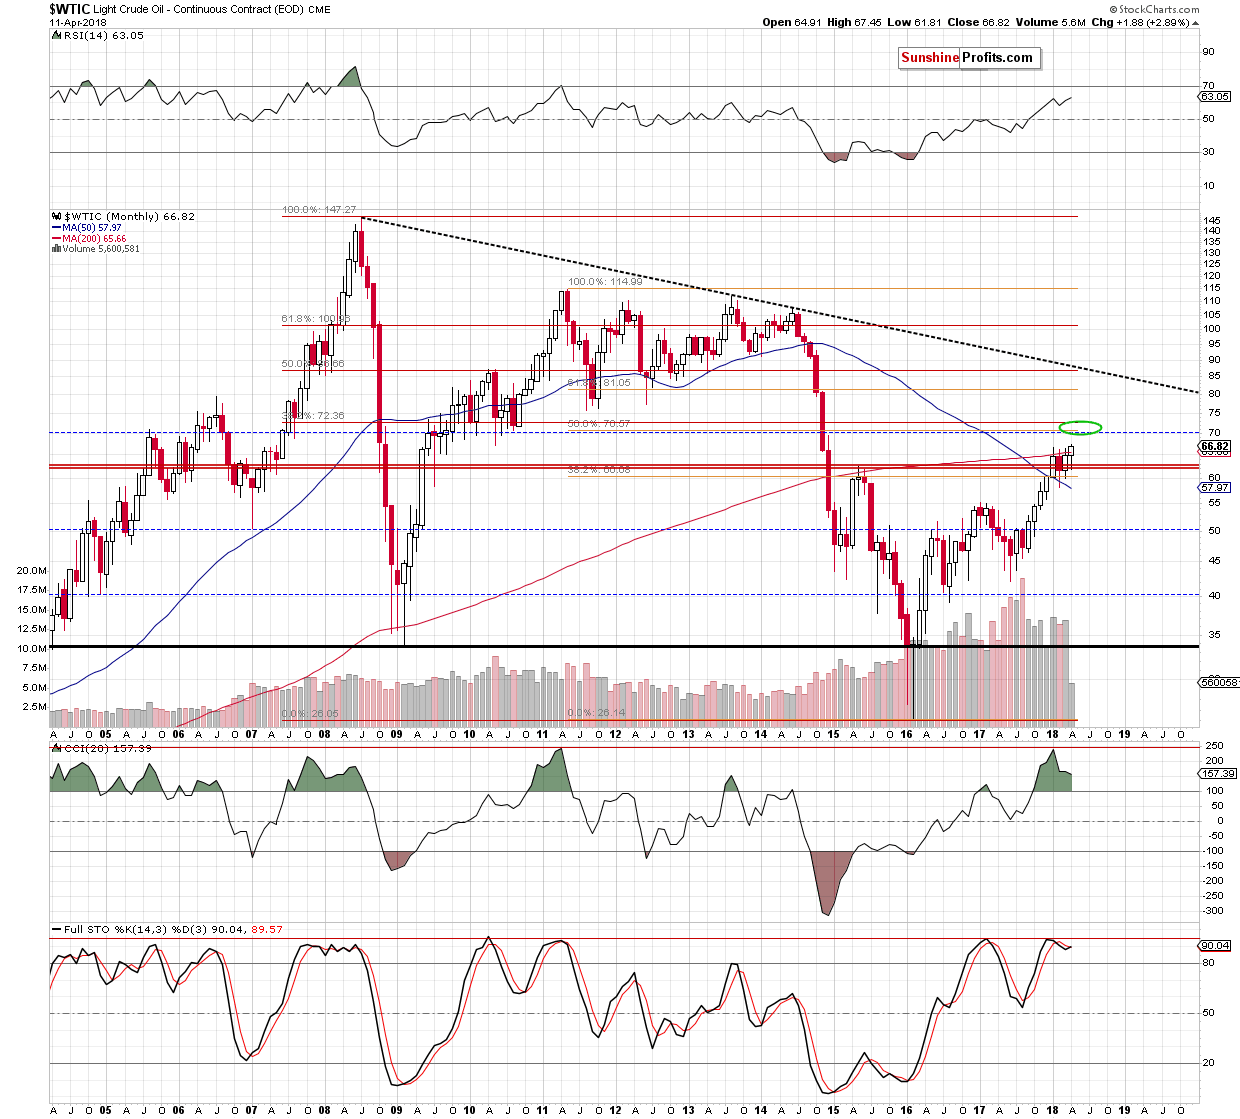
Looking at the long-term chart, we see that crude oil broke above the previous highs and the 200-month moving average, which opened the way to higher levels.
How high could light crude go? From this perspective, we see that the nearest resistance zone is not far from yesterday’s closing price (around $70-$72.36) and is created by 3 important levels: the 38.2% Fibonacci retracement based on the entire 2008-2016 downward move, the 50% retracement based on the 2011-2016 downward move and the barrier of $70.
This means that even if the price of black gold breaks through yesterday's peak, the pro-growth potential is not too big at this moment - especially when we factor in the nearest resistances marked on the daily chart below, which could disturb oil bulls’ march to the north in the coming days.
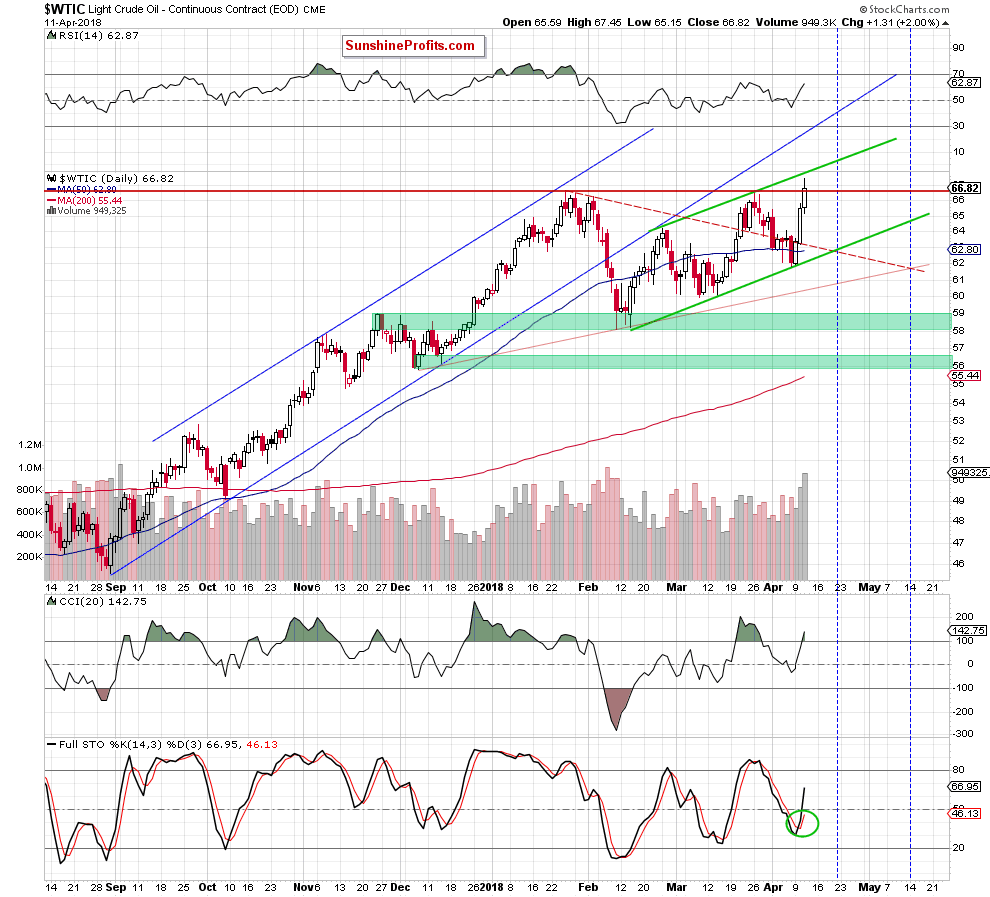
From this perspective, we see that although crude oil hit a fresh 2018 peak yesterday, the proximity to the upper border of the green rising trend channel encouraged their opponents to act. As a result, black gold pulled back a bit and closed the day slightly above the January high.
Such price action looks like a verification of the earlier breakout, which is a bullish development, however, in our opinion, as long as the commodity remains inside the green channel oil bulls may have some problems with further rally.
Will they try to push crude oil higher? Taking into account the fact that yesterday’s increase materialized on significant volume (the highest since February 7, 2018) and the buy signal generated by the Stochastic Oscillator it seems that oil bulls will not give up without fight around the previous 2018 highs.
Nevertheless, as we mentioned earlier, the space for gains seems limited – especially when we take into account Elliott waves theory. What do we mean by that? Let’s take a look at the chart below.
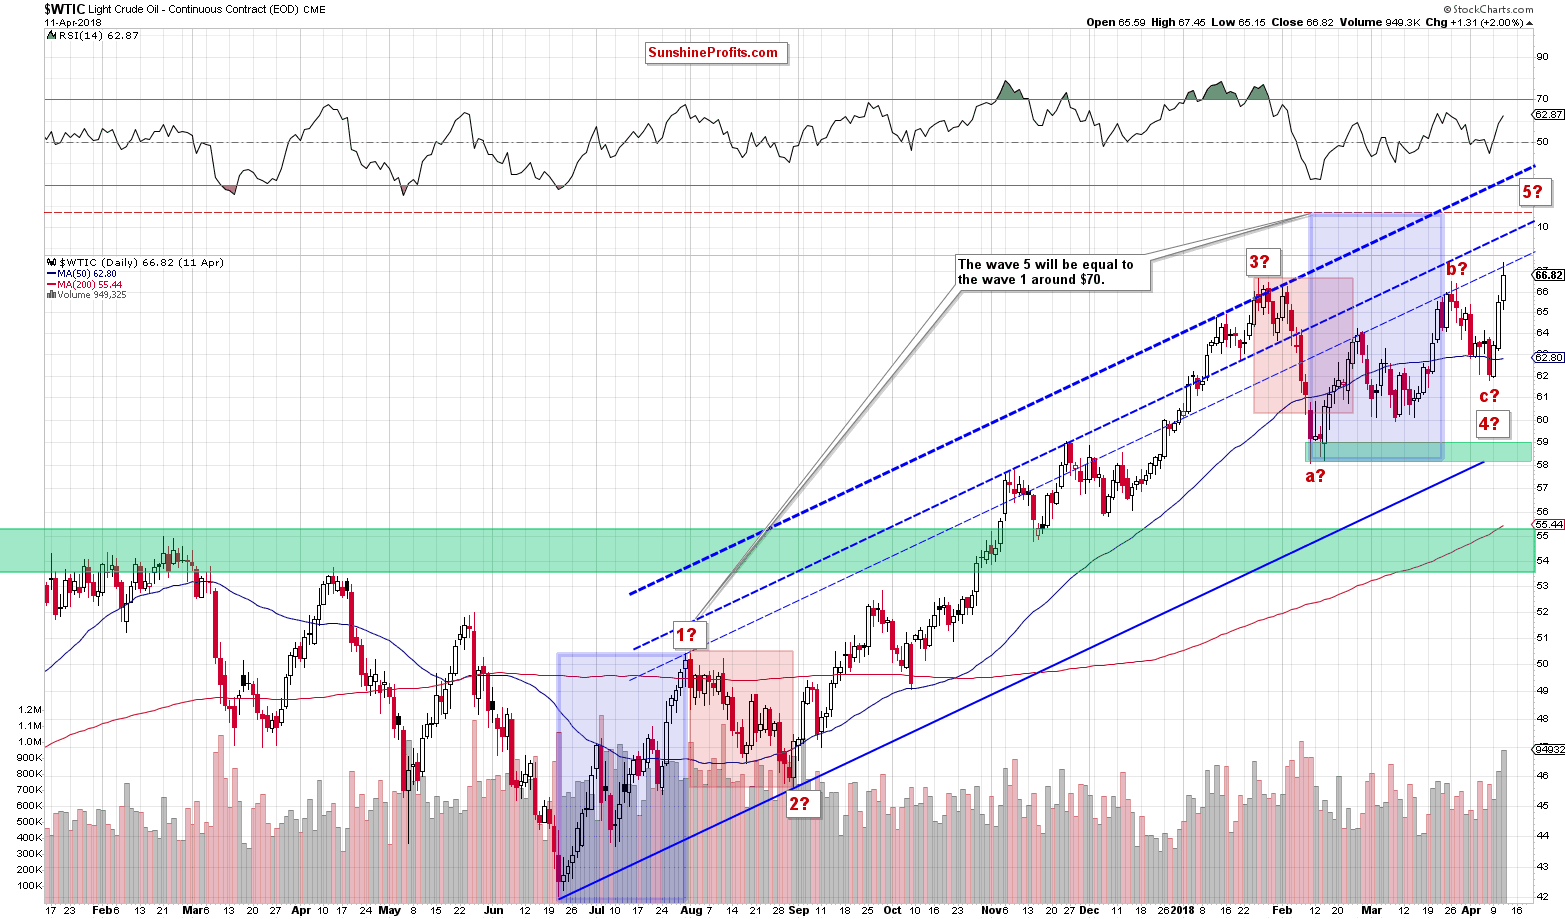
As you see on the above chart, a potential wave 5 will be equal to the wave 1 around $70, which increases the probability of reversal in this area (in other words, oil bears have one more reason to act in around the next strong resistance zone about which we wrote earlier). Therefore, we decided to wait at the sidelines for more bullish/bearish signals before we open next positions.
We’ll keep you - our subscribers - informed should anything change, or should we see a confirmation/invalidation of the above.
Trading position (short-term; our opinion): No positions are justified from the risk/reward perspective.
Thank you.
Nadia Simmons
Forex & Oil Trading Strategist
Przemyslaw Radomski, CFA
Founder, Editor-in-chief, Gold & Silver Fund Manager
Gold & Silver Trading Alerts
Forex Trading Alerts
Oil Investment Updates
Oil Trading Alerts

