

Trading position (short-term; our opinion): No position is justified from the risk/reward perspective.
Black gold erased two preceding sessions of declines and made a bullish reversal on Friday. The bulls are also on the move today. Is there any stopping them? What do the charts say? Let’s take a look together at where the market is standing right now.
We’ll start with a closer look at the chart below (charts courtesy of http://stockcharts.com).
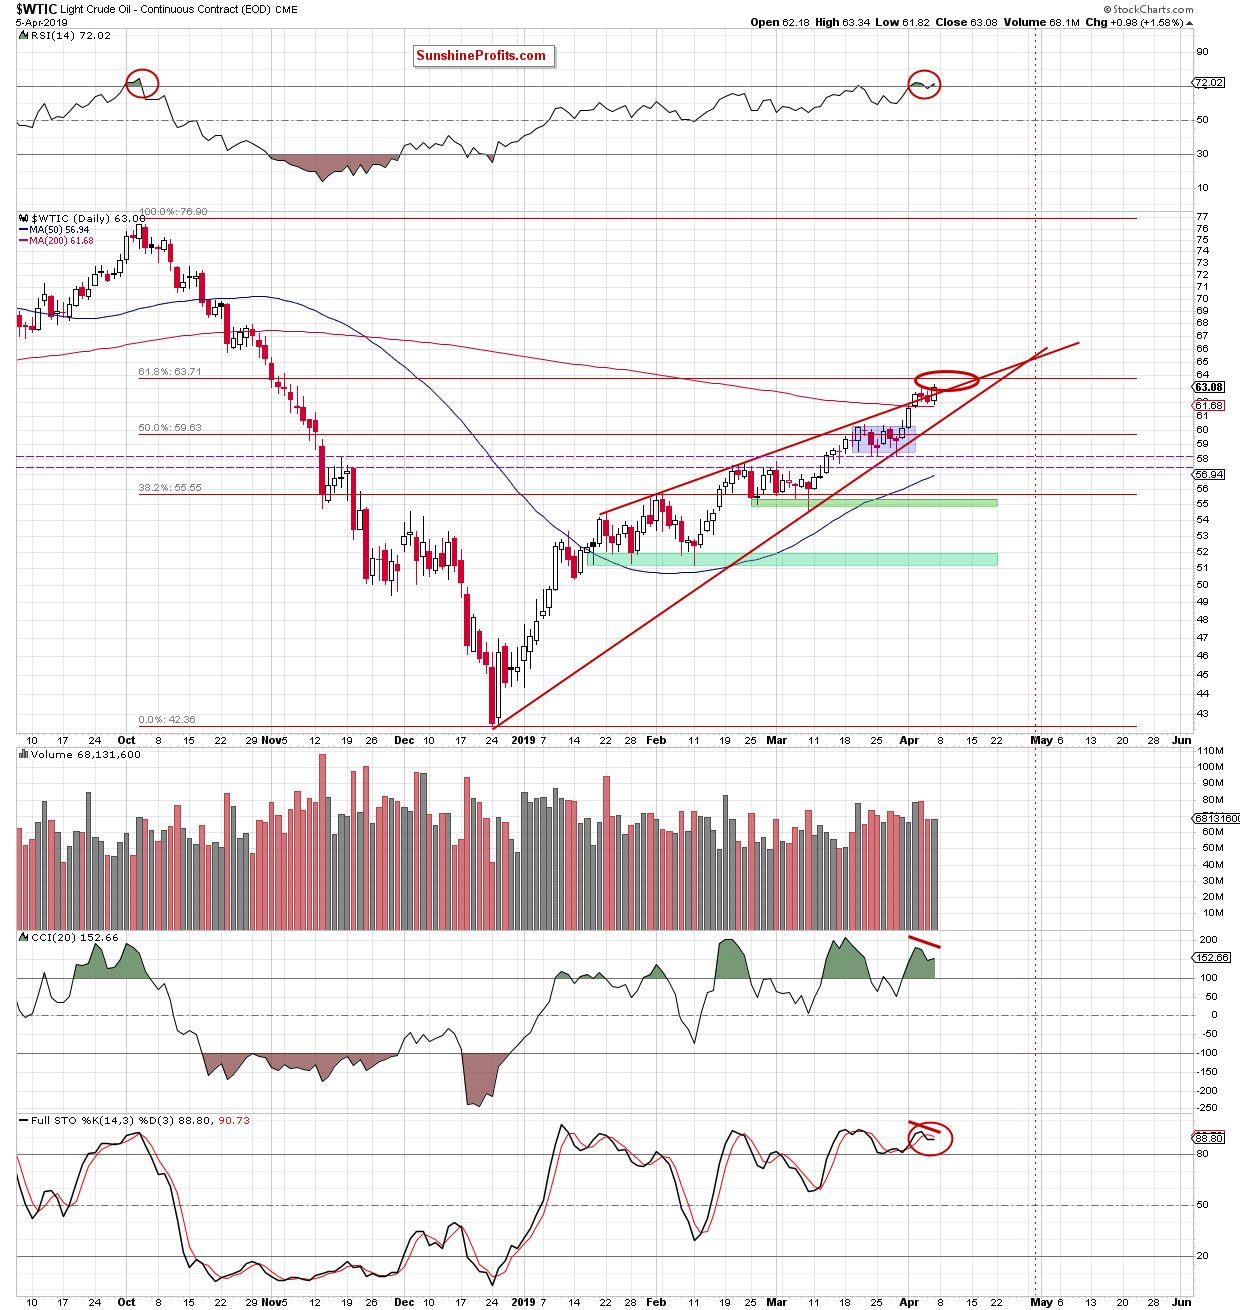
The daily chart shows that the 200-day moving average withstood Friday’s selling pressure and encouraged the buyers to act. This happened despite crude oil invalidating the earlier breakout above the upper border of the red rising wedge on Thursday.
After the two-day selling streak, oil bulls pushed the commodity slightly above $63 on Friday. Black gold hit a fresh 2019 peak and continues to build on them so far today, trading at around $64.00.
How did this increase affect the medium-term chart? Let’s take look below.
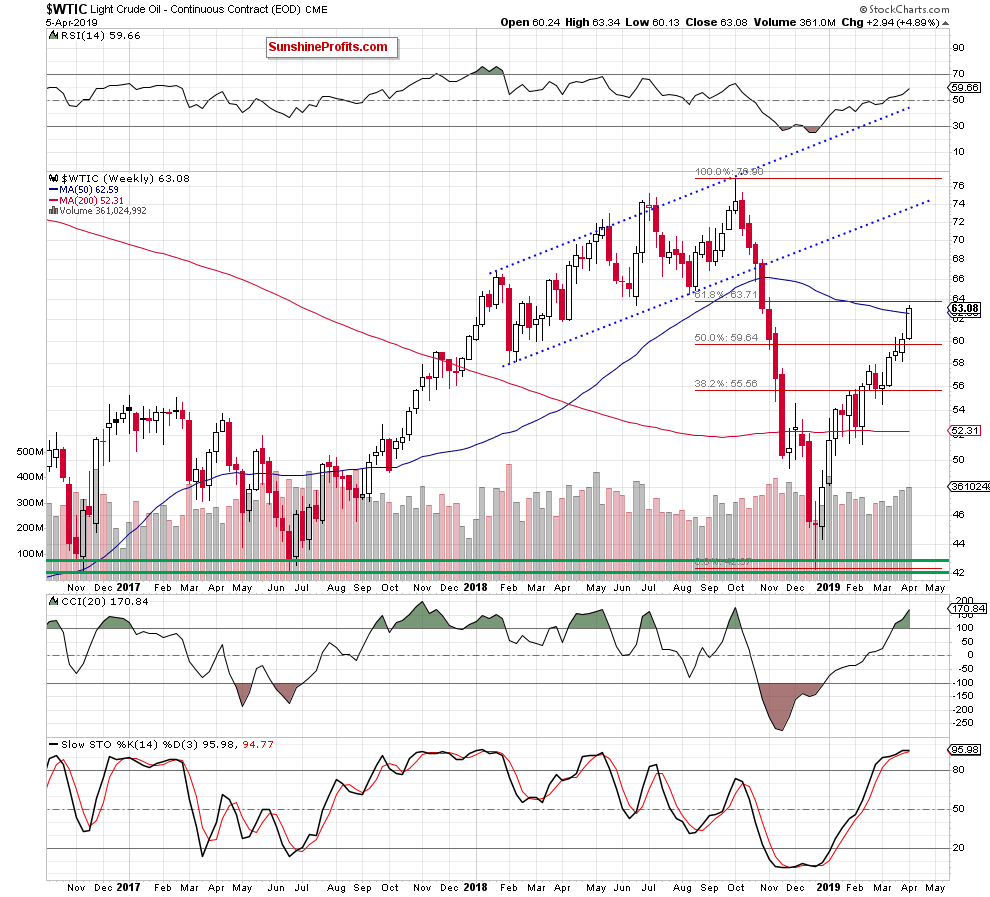
Looking at the weekly chart, we see that crude oil closed above the 50-week moving average. This is opening the way to the 61.8% Fibonacci retracement in the coming day(s).
Before finishing today’s Alert, let’s see what we can learn from the indicators’ position. Be it weekly or daily indicators, they suggest that a reversal may be just around the corner, even if the oil price moves a bit higher from current levels.
Trading position (short-term; our opinion): No position is justified from the risk/reward perspective. We will keep you informed should anything change, or should we see a confirmation/invalidation of the above.
Thank you.
Nadia Simmons
Forex & Oil Trading Strategist

