

Trading position (short-term; our opinion): No position is justified from the risk/reward perspective.
Friday was quite a day in the oil trading pit. A powerful combination of factors brought the price down significantly. Earlier today, the decline continues. How does the technical picture look currently and what can we infer about the likelihood of the next move? We invite you to examine our thoroughly analyzed outlook.
Let’s take a closer look at the charts below (charts courtesy of http://stockcharts.com).
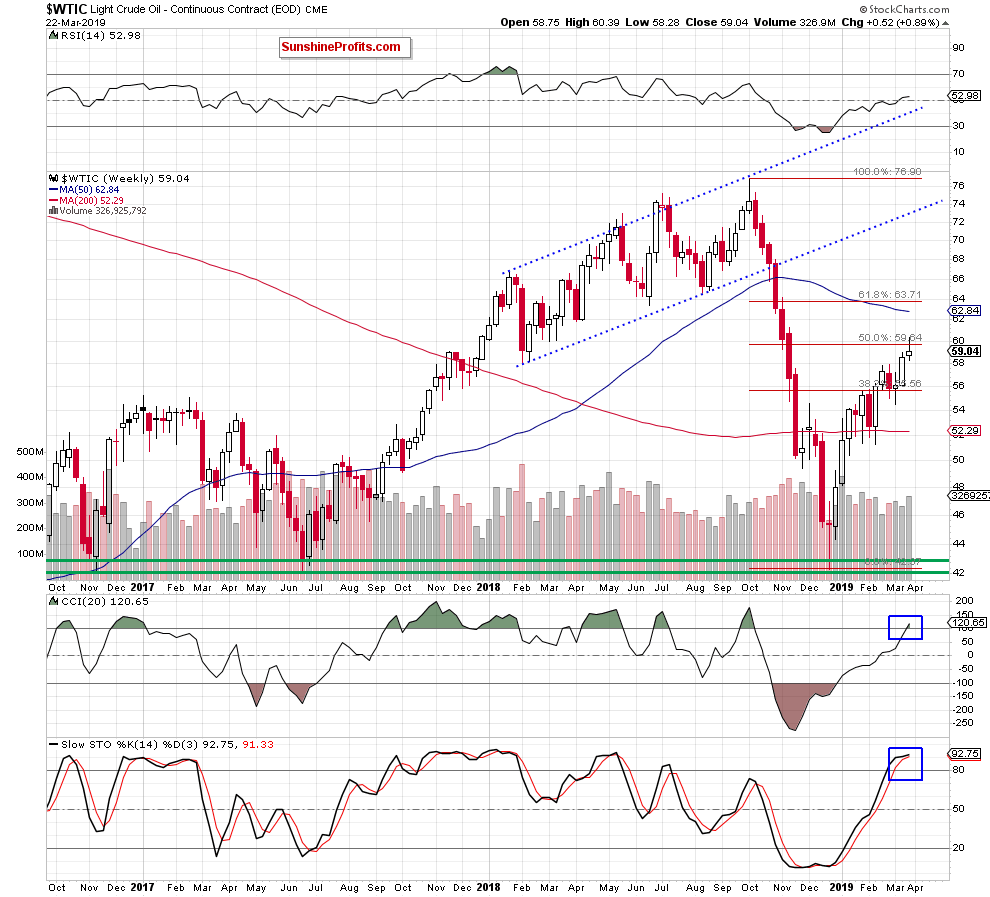
Looking at the weekly perspective, we can see that crude oil closed the previous week below the 50% Fibonacci retracement. This invalidated the earlier tiny breakout above it.
The daily indicators point in unison to one direction. The CCI climbed to its overbought area and the Stochastic Oscillator moved above 90 and flattened. These suggest that the above-mentioned direction is down as their sell signals are not too far ahead.
In our recent Alerts, we wrote about the powerful combination of resistances ahead for the bulls. Let’s quote from our Thursday’s Alert:
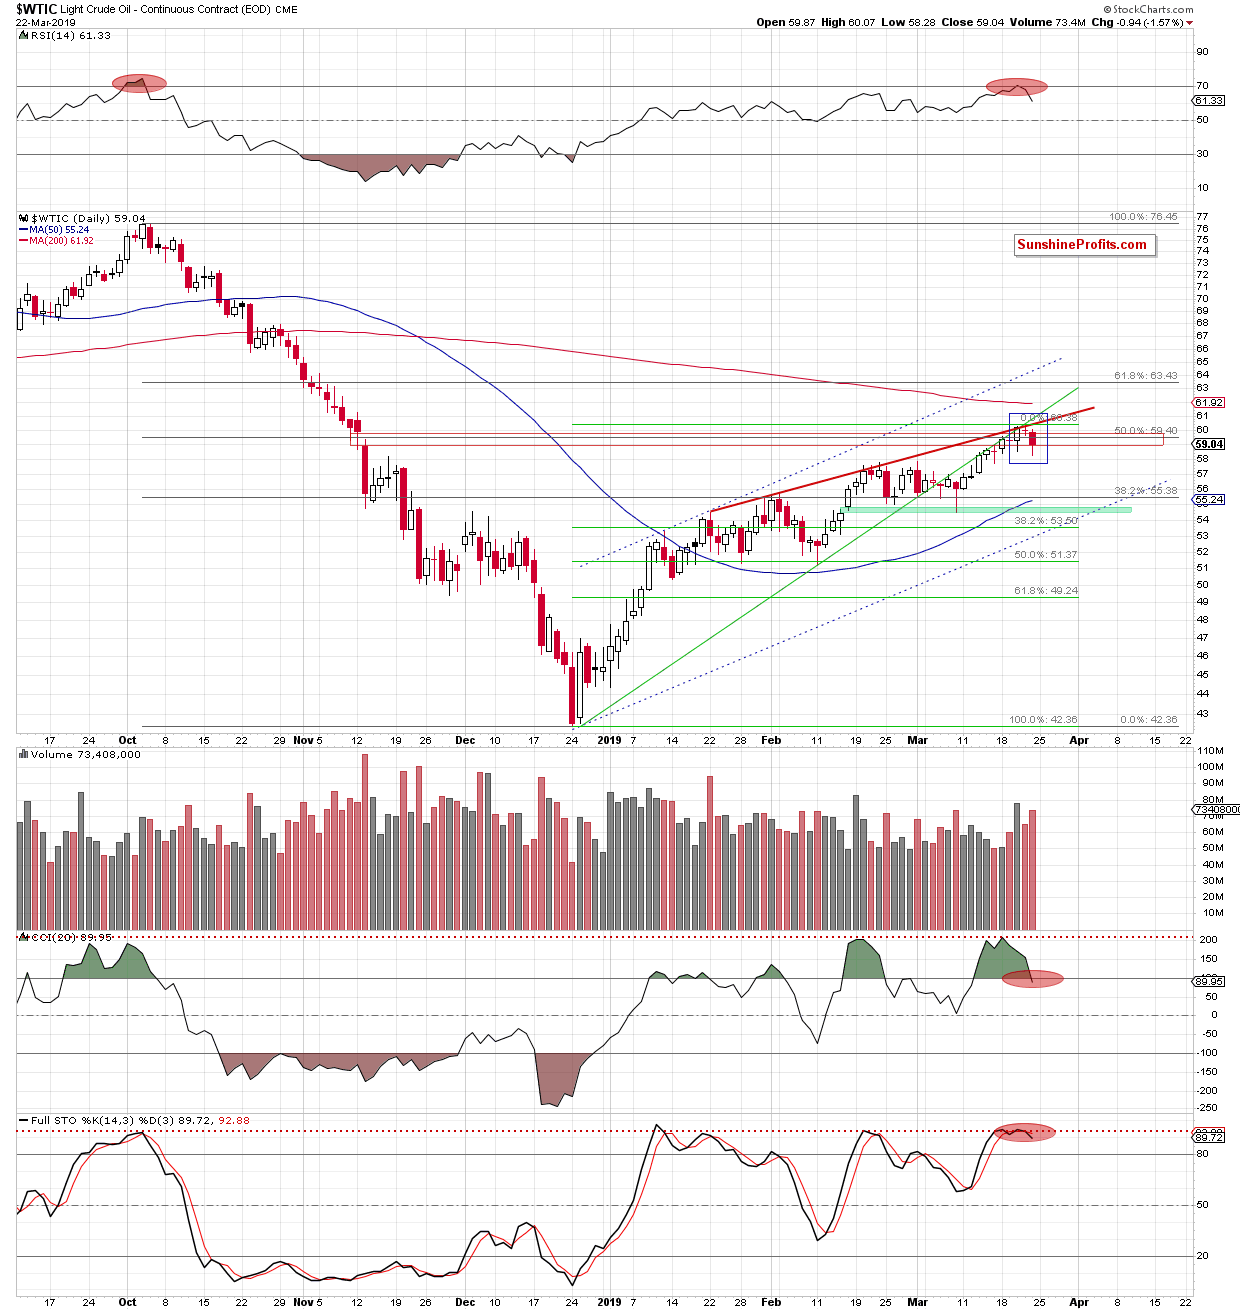
(…) However, the medium-term green line and the red resistance line based on January and February peaks have so far not been broken and continue to keep gains in check. The RSI climbed to its highest level since the November peaks. Taking a look at the CCI and Stochastics, we see clearly visible bearish divergences between their relative positions and the accompanying price action. Together with the above-mentioned resistances, the daily indicators point in the direction of a likely reversal in a very near future.
The oil bears returned to the trading floor vigorously and brought the black gold down by more than one and a half percent on Friday. This is visible as the red candlestick, which together with two previous candles created a bearish formation – evening star. Evening star is characterized by a long white candle first, gapped and compressed candle next and finally a red candle that takes the price below the middle point of the first rising candle.
The CCI and the Stochastic Oscillator generated their sell signals, increasing the likelihood of further deterioration. Nonetheless, oil is still trading above the support area created by the previously-broken February and March 2019 and mid-November 2018 peaks. Both of these are marked with two dashed horizontal purple lines on the chart below. It’s also still trading inside the red rising wedge.
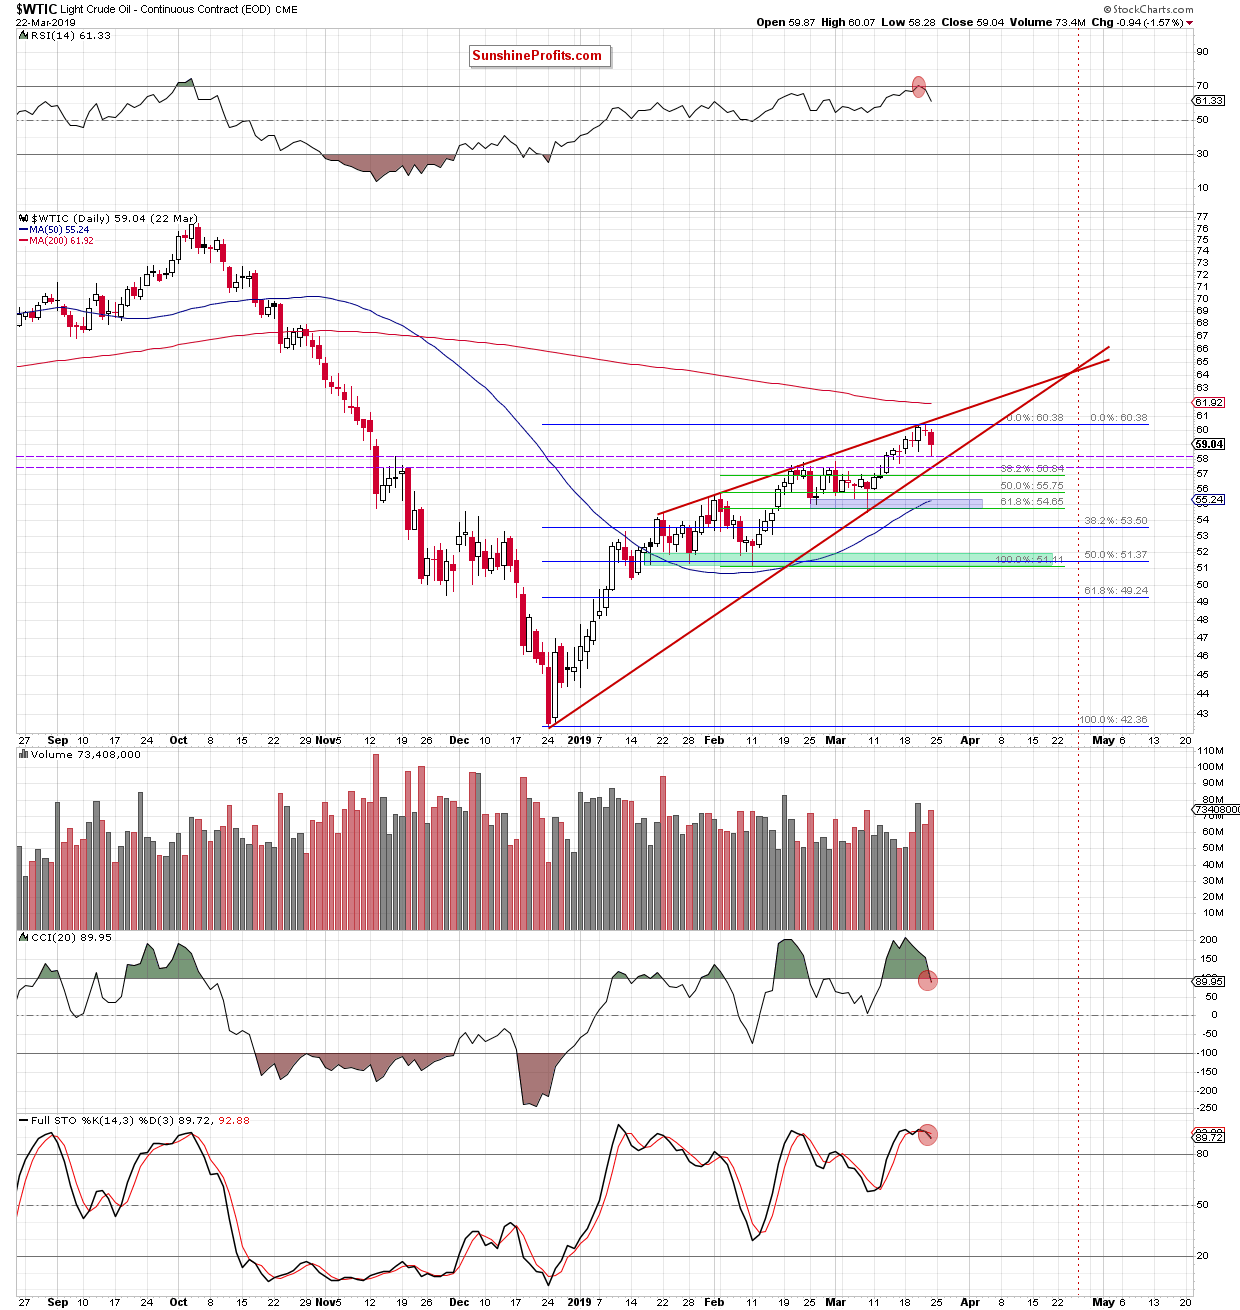
Therefore, in our opinion, a bigger move to the downside will be more likely and reliable only once we see the price moving below these lines and breaking the lower border of the red rising wedge.
Trading position (short-term; our opinion): No position is justified from the risk/reward perspective. However, if crude oil drops below the above-mentioned support levels, we’ll consider opening short positions. We will keep you informed should anything change, or should we see a confirmation/invalidation of the above.
Thank you.
Nadia Simmons
Forex & Oil Trading Strategist

