

Trading position (short-term; our opinion): Short positions with a stop-loss order at $77.44 and the initial downside target at $67.95 are justified from the risk/reward perspective.
Although black gold rebounded on Friday, oil bulls didn’t manage to come back above the previously-broken resistance lines. Is this a coincidence? Or maybe their opponents have more technical aces on their side?
Let’s take a closer look at the charts below (charts courtesy of http://stockcharts.com).
Technical Picture of Crude Oil
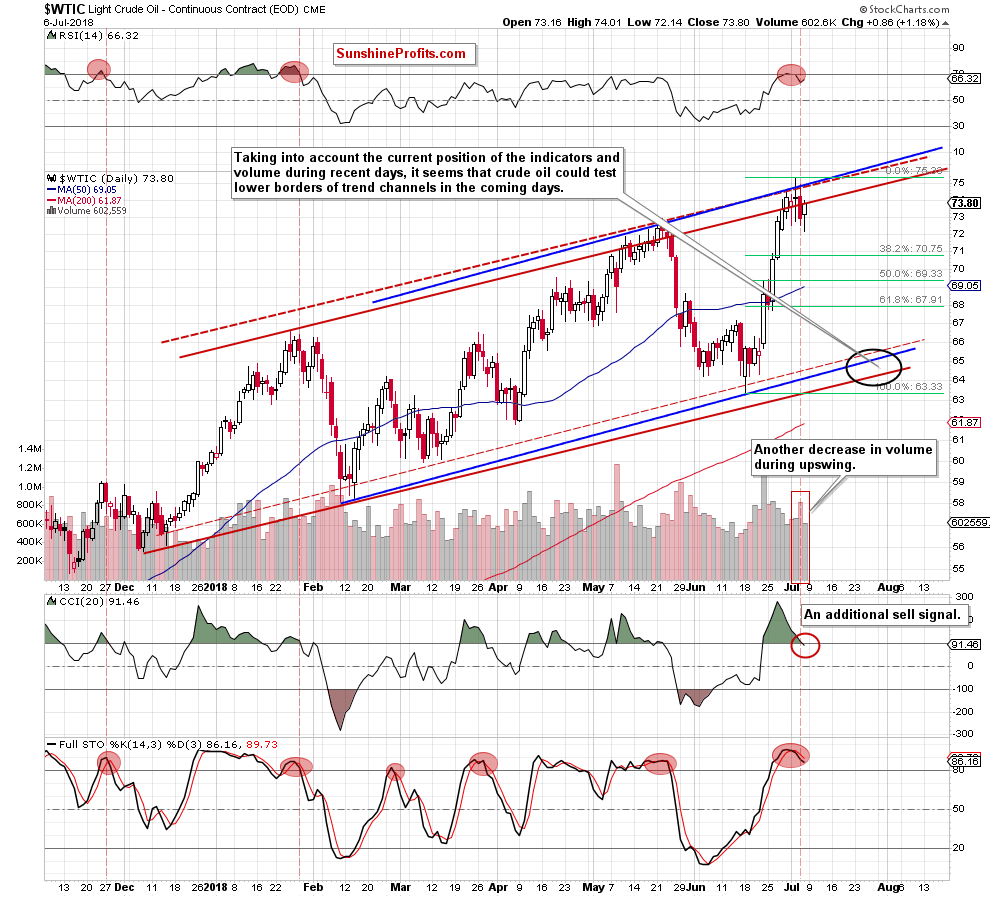
Today’s Oil Trading Alert will be quite short, because although crude oil rebounded slightly during Friday’s session, the commodity remains under not only under the upper borders of two rising trend channels (the blue and the channel marked with red dashed lines), but also under the upper line of the red rising trend channel based on intraday lows and highs.
From today’s point of view, the recent price action looks like a verification of the earlier breakdown, which gives oil bears another reason to act – especially when we factor in the fact that the CCI joined the Stochastic Oscillator and the RSI, generating a sell signal.
And speaking about the reasons… in our last alert, we wrote about the similarity between current price action and the situation that we observed in May:
(…) Back then, crude oil extended losses very quickly as oil bears showed their strength on the following days. The consequence of their pro-declining activity was a downward move, which took the price of light crude not only below the barrier of $70, but also erased most of the April-May increases.
Will history repeat itself once again? In our opinion, it is very likely, and we have 7 important arguments that support the pro-bearish scenario.
Looking at the daily chart (and analyzing the current situation in all ratios about which we wrote on Friday), we noticed that nothing changed in the short term as all pro-bearish signs remain in the cards, supporting the sellers and lower prices of crude oil in the coming days (or maybe even weeks).
Therefore, we believe that what we wrote in our last commentary on this commodity is still valid and if you haven’t had the chance to read, we encourage you to do so today:
Crude Oil and Its Another Interesting Relationship
Nevertheless, finishing today’s alert, we would like to add one more chart and a very short note about it.
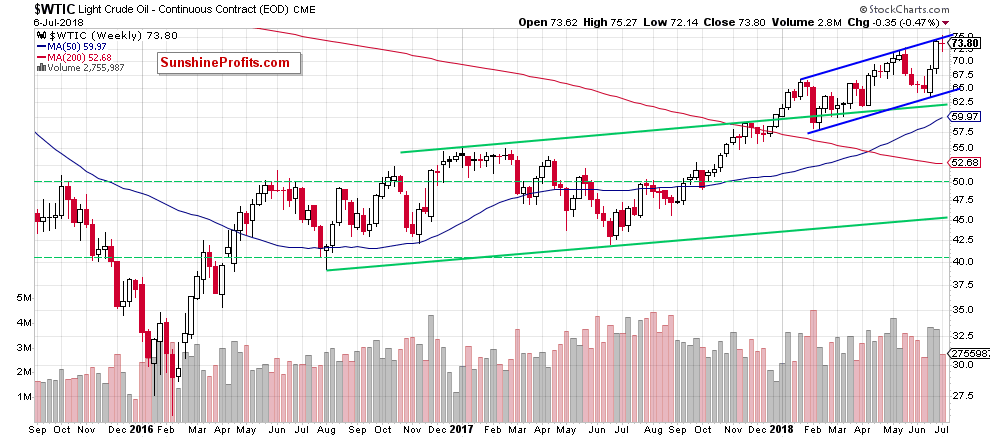
From this perspective, we see that last week's confrontations between oil bulls and oil bears led to the creation of a doji candlestick on the weekly chart.This candlestick pattern forms usually due to indecision between the buyers and sellers in the market, which increases the probability of another move to the downside – even if oil bulls try to go higher once again.
At this point, it is worth noting that similar situation we saw at the beginning of June 2016, January 2017, February 2017 and also in April 2018. In all these cases, the above-mentioned candlesticks paused oil bulls or preceded a bigger corrective move to the downside, which suggests that we can see something similar in the coming week(s).
Summing up, short positions continue to be justified from the risk/reward perspective as crude oil verified the earlier breakdown under the upper line of the rising trend channel (based on an intraday highs and lows), increasing the probability of another downswing. Additionally, all daily indicators support oil bears at the moment of writing this alert, which suggests that lower prices of black gold are just around the corner.
Trading position (short-term; our opinion):Short positions with a stop-loss order at $77.44 and the initial downside target at $67.95 are justified from the risk/reward perspective.We will keep you informed should anything change, or should we see a confirmation/invalidation of the above.
Thank you.
Nadia Simmons
Forex & Oil Trading Strategist
Przemyslaw Radomski, CFA
Founder, Editor-in-chief, Gold & Silver Fund Manager
Gold & Silver Trading Alerts
Forex Trading Alerts
Oil Investment Updates
Oil Trading Alerts

