

Trading position (short-term; our opinion): Long positions (with the stop-loss order at $65.10 and the next upside target at $73.47) are justified from the risk/reward perspective.
Even though Tuesday’s session began very well for oil bulls, the combination of several resistances lured out their opponents, who decided to get something for themselves. Thanks to their activity, the price of crude oil came back below the barrier of $70, invalidating the earlier breakouts. From the bulls’ point of view, such situation may look quite gloomy, but is it really anything to worry about?
Let’s examine the charts below to find out (charts courtesy of http://stockcharts.com).
Technical Picture of Crude Oil
Quoting our Thursday’s alert:
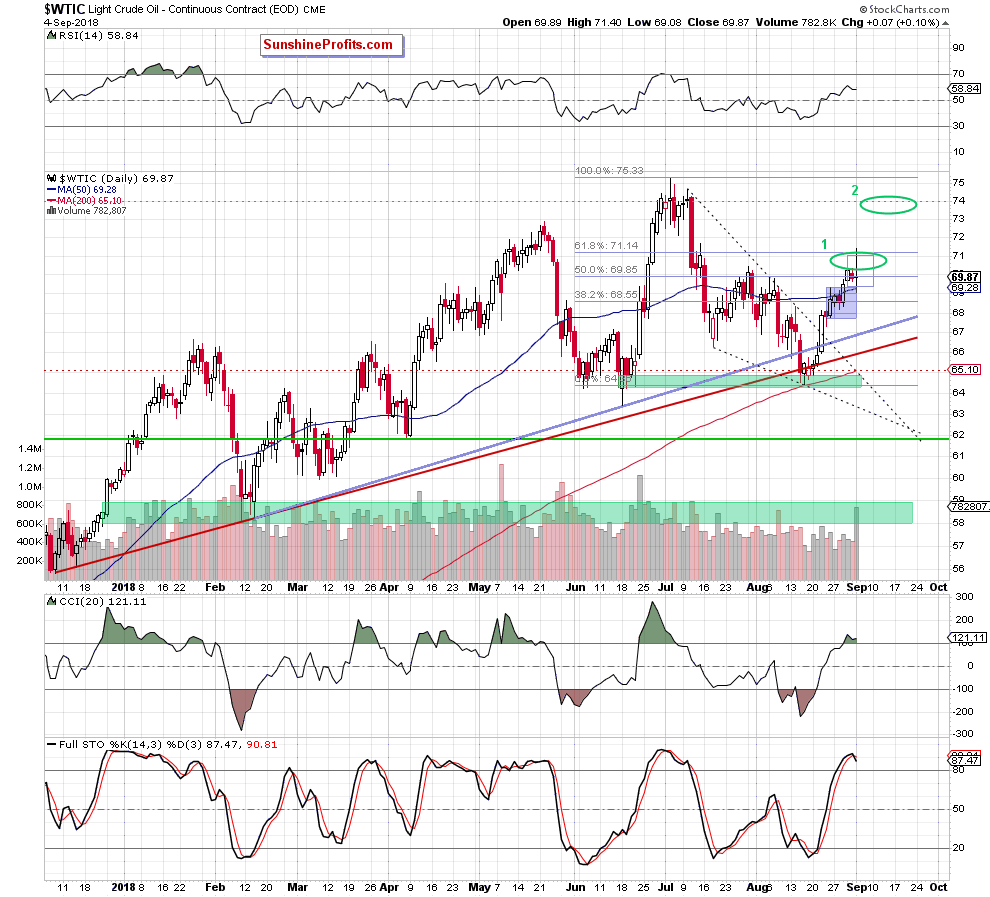
(…) the commodity broke above the upper border of the very short-term blue consolidation, which suggests further improvement and an upward move to around $70.84, where the size of increase will correspond to the height of the above-mentioned consolidation.
If this is the case and we see such price action, light crude will hit our initial upside target (we marked it with the first green ellipse) in the coming day(s). Slightly above it is also the 61.8% Fibonacci retracement, which will be the next target for the buyers.
From today’s point of view, we see that the situation developed in tune with our assumptions and black gold increased even slightly above our initial upside target.
Thanks to this move, the commodity also climbed above the late-July peaks and the 61.8% Fibonacci retracement, which encouraged oil bears to act. As a result, the price pulled back and came back under the barrier of $70, invalidating the earlier tiny breakouts.
Although this is a negative development, light crude closed the day above the previously-broken 50-day moving average and the upper line of the blue consolidation, which looks like a verification of the earlier breakout.
If this is the case, the price of black gold will likely turn north once again, and we see at least a test of yesterday’s high.
This scenario is also reinforced by the narrower picture of the commodity. Let’s take a closer look at the 4-hour chart below.
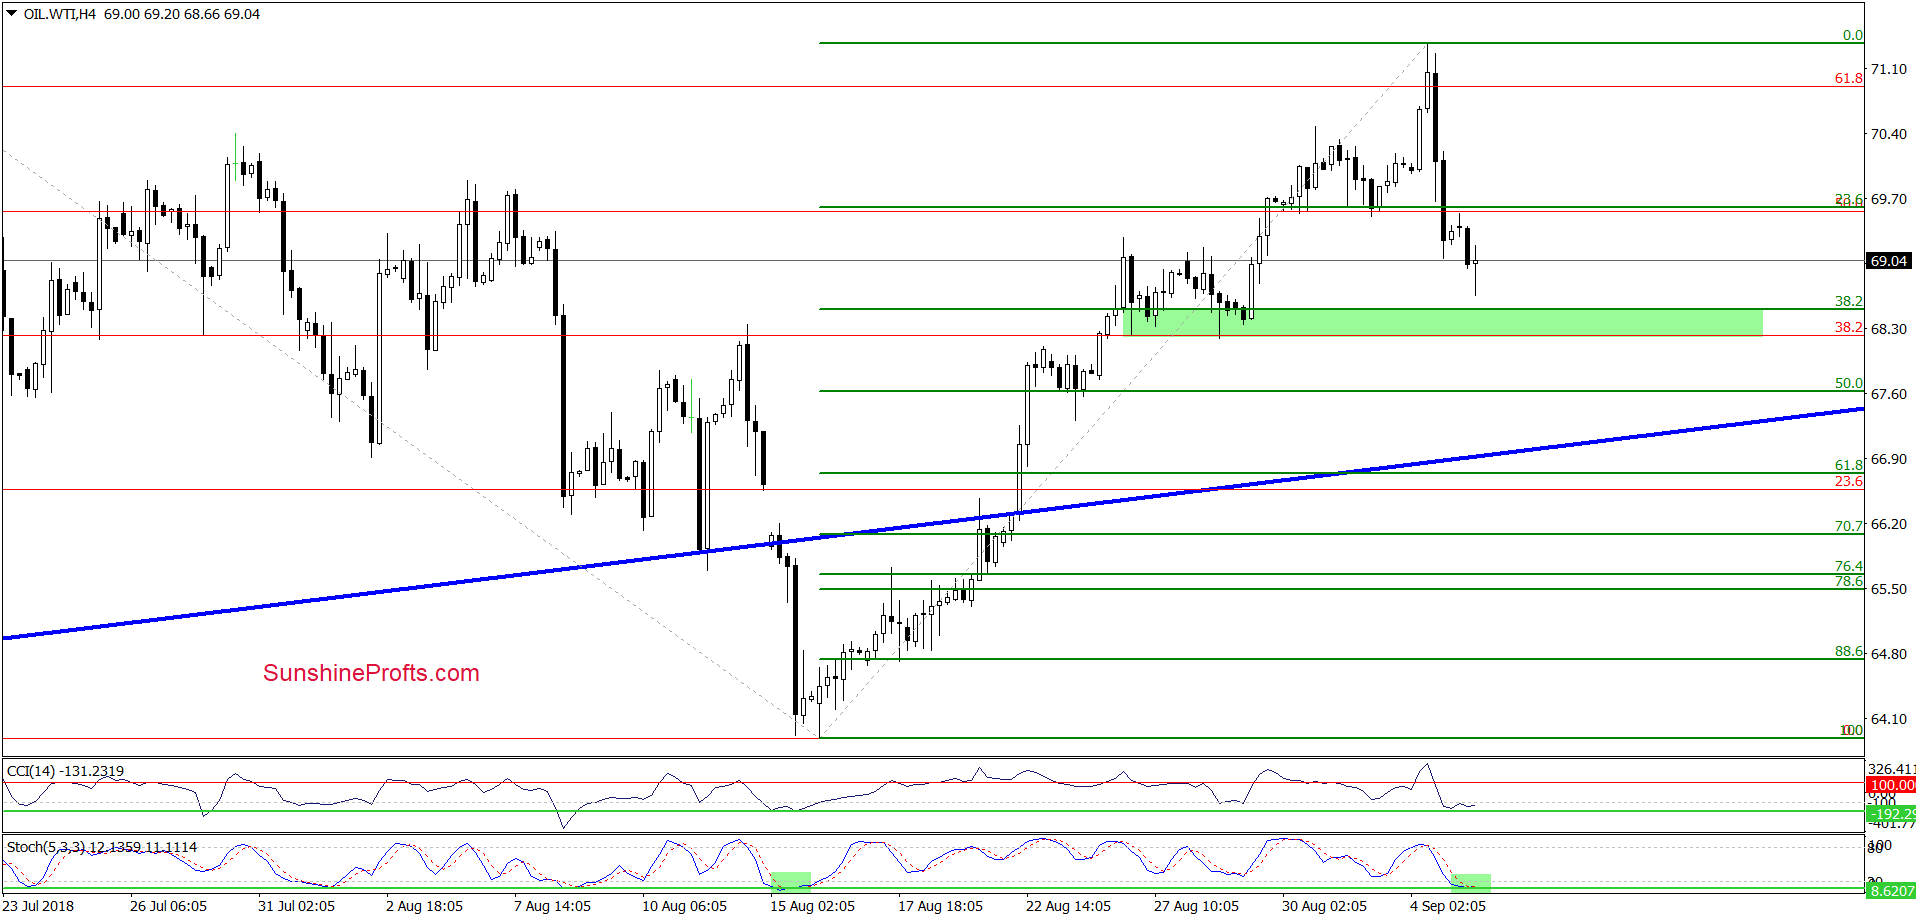
From this perspective, we see that Tuesday’s drop approached light crude to the green support zone created by the 38.2% Fibonacci retracement (based on the entire August upward move) and late-August lows, which means that even if the price moves a bit lower, the space for declines seems limited in the very short term.
Additionally, the Stochastic Oscillator slipped to the lowest level since mid-August (we marked both situations with the green rectangles). What does it mean for cure oil?
As you see, back then, such low reading of the indicator preceded a sizable move to the upside, which suggests that if the history repeats itself once again, the price of crude oil will increase to (at least) a fresh high in the very near future.
Therefore, we believe that long positions continue to be justified from the risk/reward perspective.
Trading position (short-term; our opinion): Long positions (with the stop-loss order at $65.10 and the next upside target at $73.47) are justified from the risk/reward perspective. We will keep you informed should anything change, or should we see a confirmation/invalidation of the above.
Thank you.
Nadia Simmons
Forex & Oil Trading Strategist
Przemyslaw Radomski, CFA
Founder, Editor-in-chief, Gold & Silver Fund Manager
Gold & Silver Trading Alerts
Forex Trading Alerts
Oil Investment Updates
Oil Trading Alerts

