

Trading position (short-term; our opinion): Short positions (with the stop-loss order at $68.15 and the initial downside target at $58.10) are justified from the risk/reward perspective.
The test of the resistance line, the triangle apex reversal, the a-b-c waves in the zigzag pattern… What connects them? Give us 28 paragraphs and 975 words and you will see that these seemingly mismatched concepts will form a meaningful and promising scenario.
Technical Analysis of Crude Oil
Let's start with the well-known daily chart (charts courtesy of http://stockcharts.com).
In our last Oil Trading Alert, we wrote the following:
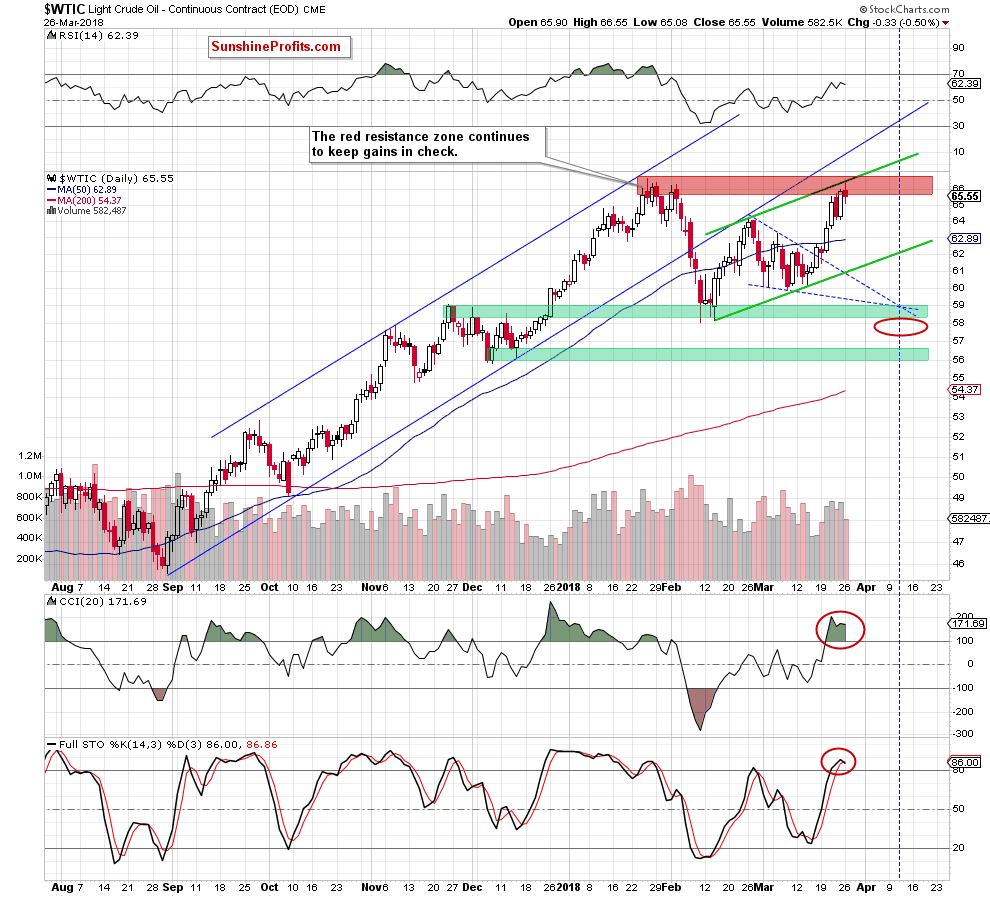
(…) oil bulls took control shortly after the opening of the Friday session (…) and climbed to the major resistance zone, which stopped light crude’s rally at the end of January, triggering declines in the following weeks.
Will history repeat itself once again and we see similar price action in the coming days?
As you see on the daily chart, the red resistance zone created by the previous 2018 peaks is currently reinforced by the upper border of the green rising trend channel, which suggests that reversal may be just around the corner – especially when we factor in the fact that the daily indicators increased to their overbought areas, which could translate into sell signals in the very near future.
From today’s point of view, we see that the situation developed in tune with our assumptions and crude oil reversed and pulled back after the test of upper border of the green rising trend channel, which suggests further deterioration in the coming days.
But will we really see the next downward move in near future? After all, oil bears disappointed us many times during the last month, so why should it be different now and why we should trust them?
The Reasons
First, the bears have on their side the above-mentioned strong resistance zone, which successfully stopped their opponents two times earlier this year.
Second, the Stochastic Oscillator generated the sell signal.
Third, Elliott wave theory…
What do we mean by that? Let’s examine the chart below.
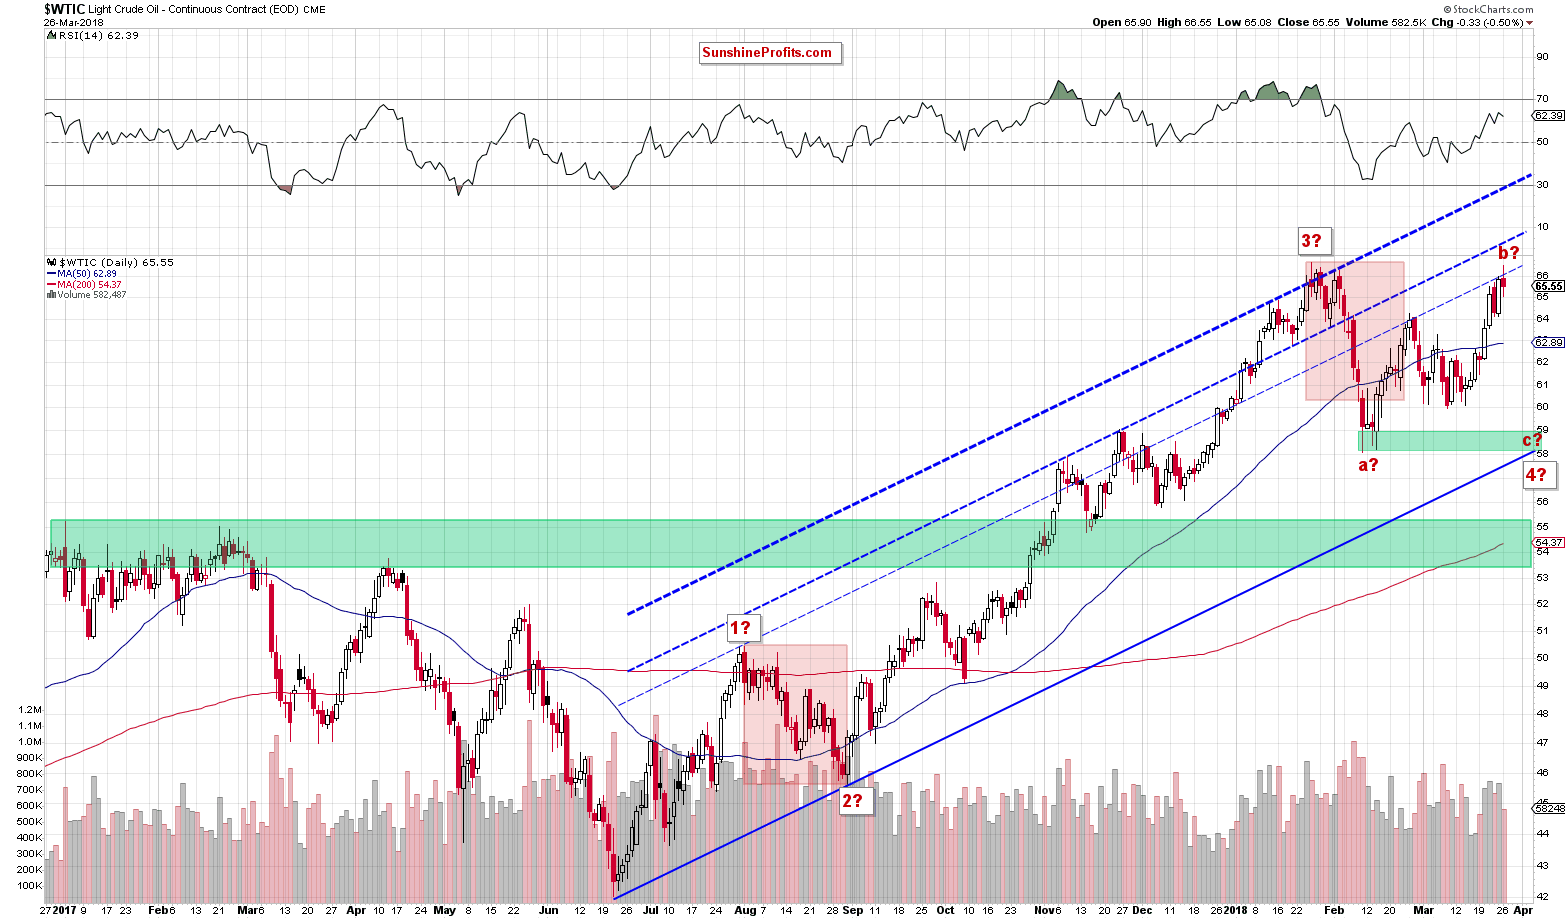
Looking at the daily chart once again (but this time from a wider and different perspective), you can see that we divided the entire upward move, which started in June 2017 for individual waves in accordance with Elliott wave theory.
The potential first wave ended on August 1, 2017, the second wave ended on August 31. The third wave stretched until January 25. After this peak the price of crude oil corrected the previous upward move, which created the first wave (marked with a) in a potential zigzag pattern. As you see, the green support zone triggered a rebound, which created a potential wave b of a zigzag, which includes another zigzag at the moment of writing these words.
What does it mean for crude oil and how oil bears can use this pattern?
The most important feature of wave b is that it cannot retrace 100% of wave a. In other words, if the above sequence of waves is well-written, we’ll see another downward move in the coming days. In this way, black gold will create wave c in the above-mentioned big zigzag.
How Low Could Crude Oil Go?
If crude oil goes to the south from current levels, we’ll see (at least) a decline to the lower border of the medium-term blue rising trend channel seen on the above chart (currently around the February low of $58.10).
This is the Time, This is the Place
Once we already know where (potentially) the next wave of declines will head, it's time to find out when we can expect another bigger reversal that will end the move to the downside. What can help us with this issue?
If you do not know yet, don’t worry about that, because we will describe everything in the following paragraphs (after all, you have us to analyze the charts carefully and share our insights).
So, coming back to the earlier question... what can help us determine the date of the next reversal? Triangle apex reversal pattern. What does it mean in practice?
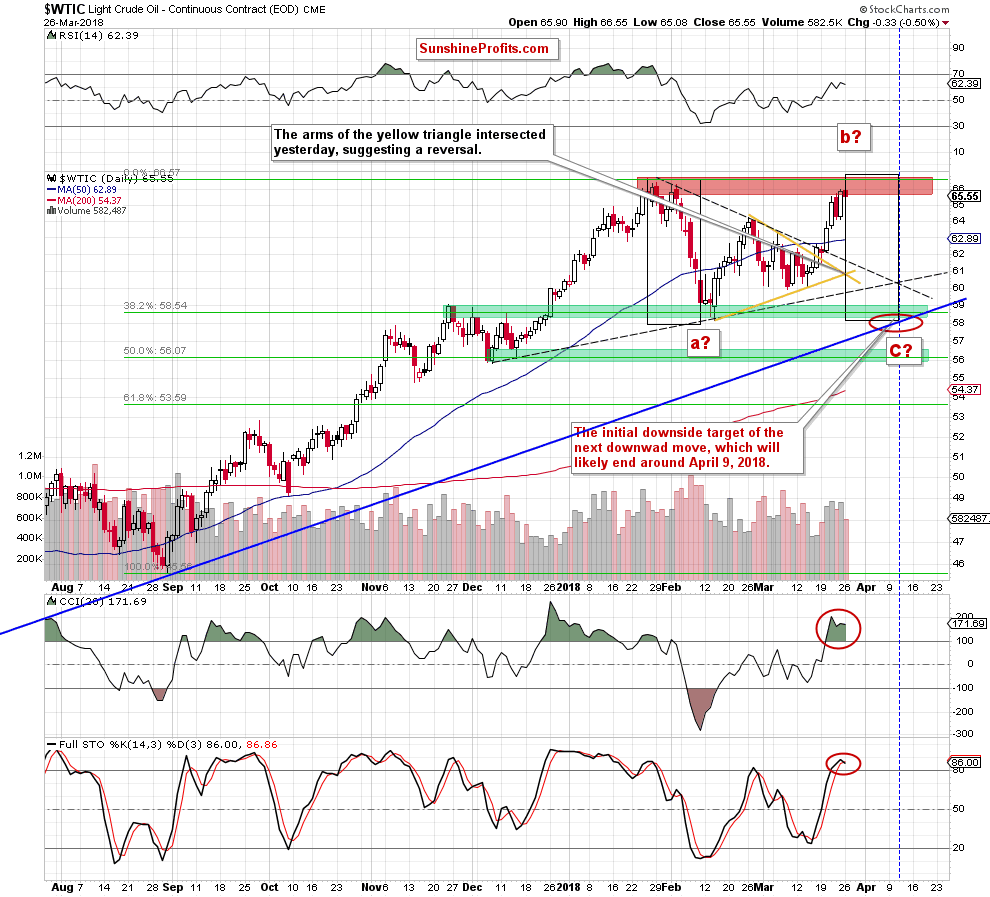
Looking at the above chart, you can see the yellow triangle created by the resistance line based on the late February and early March highs and the support line based on the mid-February and mid-March lows. The intersection of his arms took place yesterday, which resulted in a reversal.
On the above chart, however, we can notice one more tringle (marked with the black dashed lines). As you see, it is created by the resistance line based on the February peaks and the support line based on the December and February lows. When will these lines intersect? Around April 10. What’s interesting, this date is also confirmed by the blue triangle (we marked it with dashed lines on the first daily chart in today’s alert) and two medium-term triangles seen on the weekly chat below.
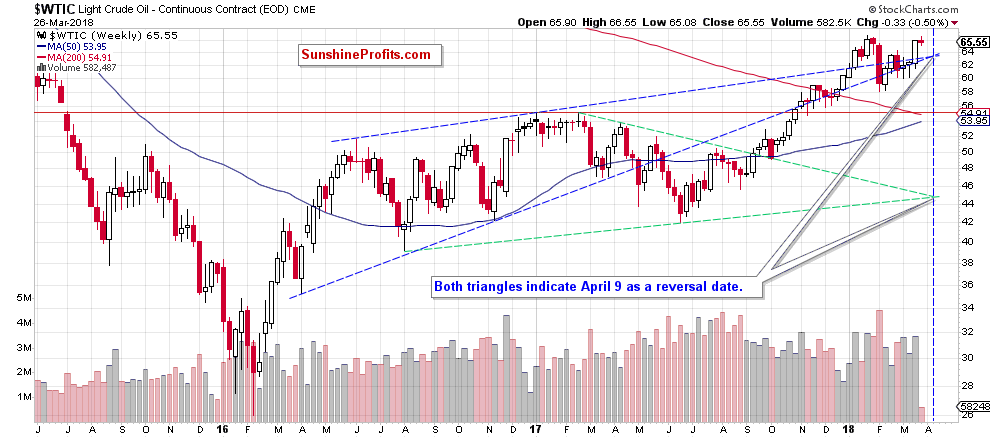
From this perspective, we see that the blue triangle is created by the resistance line based on the June 2016 and January 2017 peaks and the support line based on the April 2016 low and mid-November 2016 low. The green triangle is created by the resistance line based on the February and April 2017 highs and the support line based on the August 2016 and June 2017 lows.
Additionally, analyzing the above chart, we noticed that April 4, 2016 and April 10, 2017 brought reversals, which increases the probability that we’ll likely similar price action in the coming month.
Will April 9/10, 2018 show the bottom of the fourth wave in the five-wave sequence? Taking all the above into account and combining it with the fact that in the same “time zone” the duration of the wave c will be equal to the duration of the wave a (we marked them with black rectangles on the last daily chart) we believe that oil bears will do their best and realize this scenario, making our short positions profitable.
Finishing today’s Oil Trading Alert, please keep in mind that the above waves’ structure may break only if the price of light crude increases above the major red resistance zone. Nevertheless, at the moment of writing these words, all available technical and fundamental factors favor the pro-bearish scenario in the following weeks.
As always, we’ll keep you - our subscribers - informed should anything change, or should we see a confirmation/invalidation of the above.
Trading position (short-term; our opinion): Short positions (with the stop-loss order at $68.15 and the initial downside target at $58.10) are justified from the risk/reward perspective. As always, we’ll keep you - our subscribers - informed should anything change, or should we see a confirmation/invalidation of the above.
Thank you.
Nadia Simmons
Forex & Oil Trading Strategist
Przemyslaw Radomski, CFA
Founder, Editor-in-chief, Gold & Silver Fund Manager
Gold & Silver Trading Alerts
Forex Trading Alerts
Oil Investment Updates
Oil Trading Alerts

