

Trading position (short-term; our opinion): Small (half of the regular size) short positions (with a stop-loss order at $61.13 and the initial downside target at $52) are justified from the risk/reward perspective.
On Tuesday, crude oil lost almost 2% and invalidated the earlier breakout above important resistance line. Is it enough to push black gold below the early 2017 peaks?
Crude Oil’s Technical Picture
Let’s examine the technical picture of the commodity (charts courtesy of http://stockcharts.com).
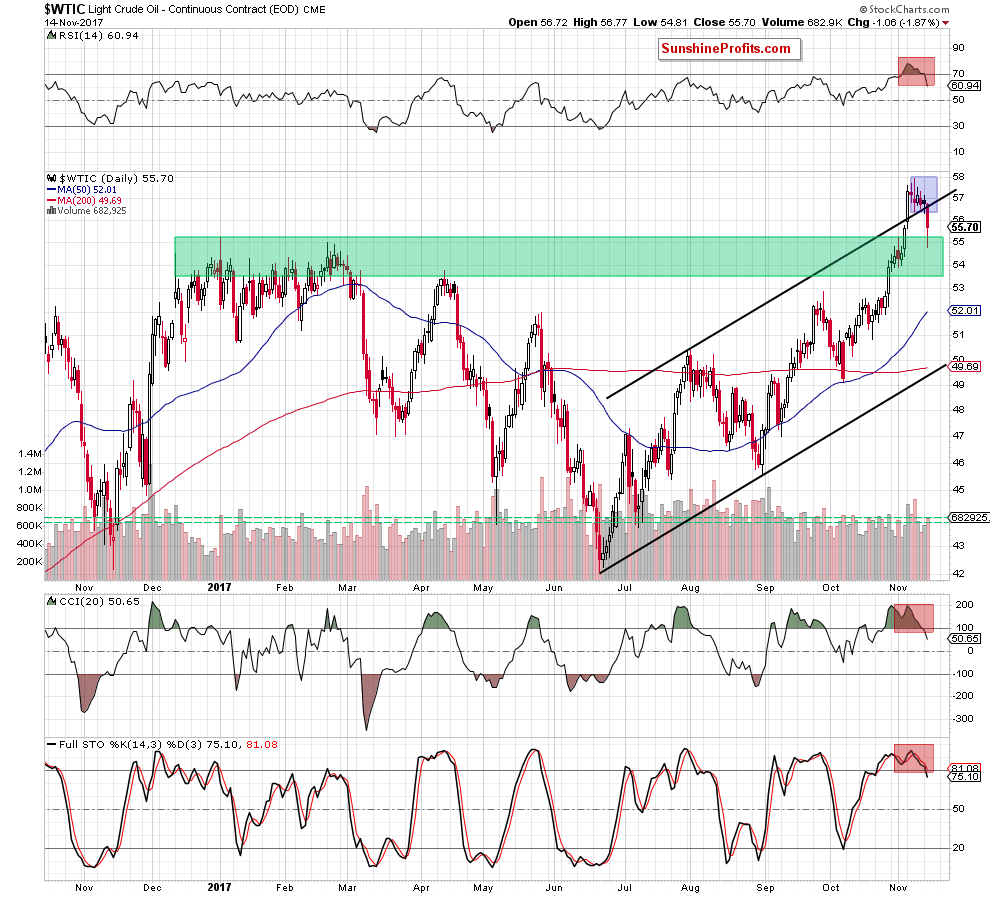
The first thing that catches the eye on the daily chart is an invalidation of the earlier breakout above the upper border of the black rising trend channel, which is a bearish development. Why? When we focus on Tuesday price action, we see that the size and the shape of yesterday candlestick clearly shows that oil bears took control very quickly, because their opponents managed to push the commodity only 5 cents after the market open.
This show of weakness together with another drop under the upper line of the black trend channel triggered further deterioration and a test of the green support zone created by the early 2017 highs. In this area oil bulls decided to fight, which resulted in a corrective pullback and a comeback above January peak.
Despite this move, black gold closed yesterday session well below the upper border of the trend channel, which in combination with the size of yesterday volume and sell signals generated by all three indicators (the RSI generated the sell signal for the first time since more than a year) suggest that another attempt to move lower is just around the corner.
The pro bearish scenario is also reinforced by the current situation in the oil-to-gold ratio. Let’s take a look at the charts below.
Crude Oil – Gold Link
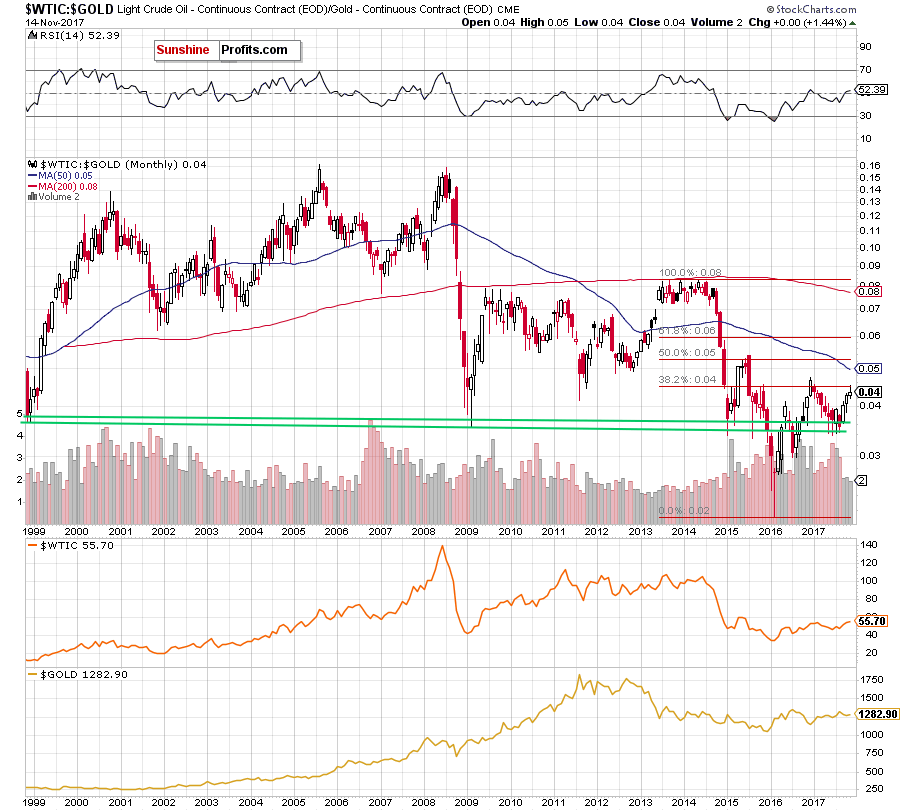
As you see on the above chart, the ratio extended gains, which resulted in a climb to the 38.2% Fibonacci retracement earlier this month. What does it suggests? As you know from our earlier alerts, this is the first important retracement, which usually is strong enough to stop or (at least) pause bulls. Therefore, the recent price action suggests that we could see a reversal and declines – similarly to what we saw at the beginning of the year.
Additionally, when we focus on the medium-term chart below, we can see some more bearish signs.
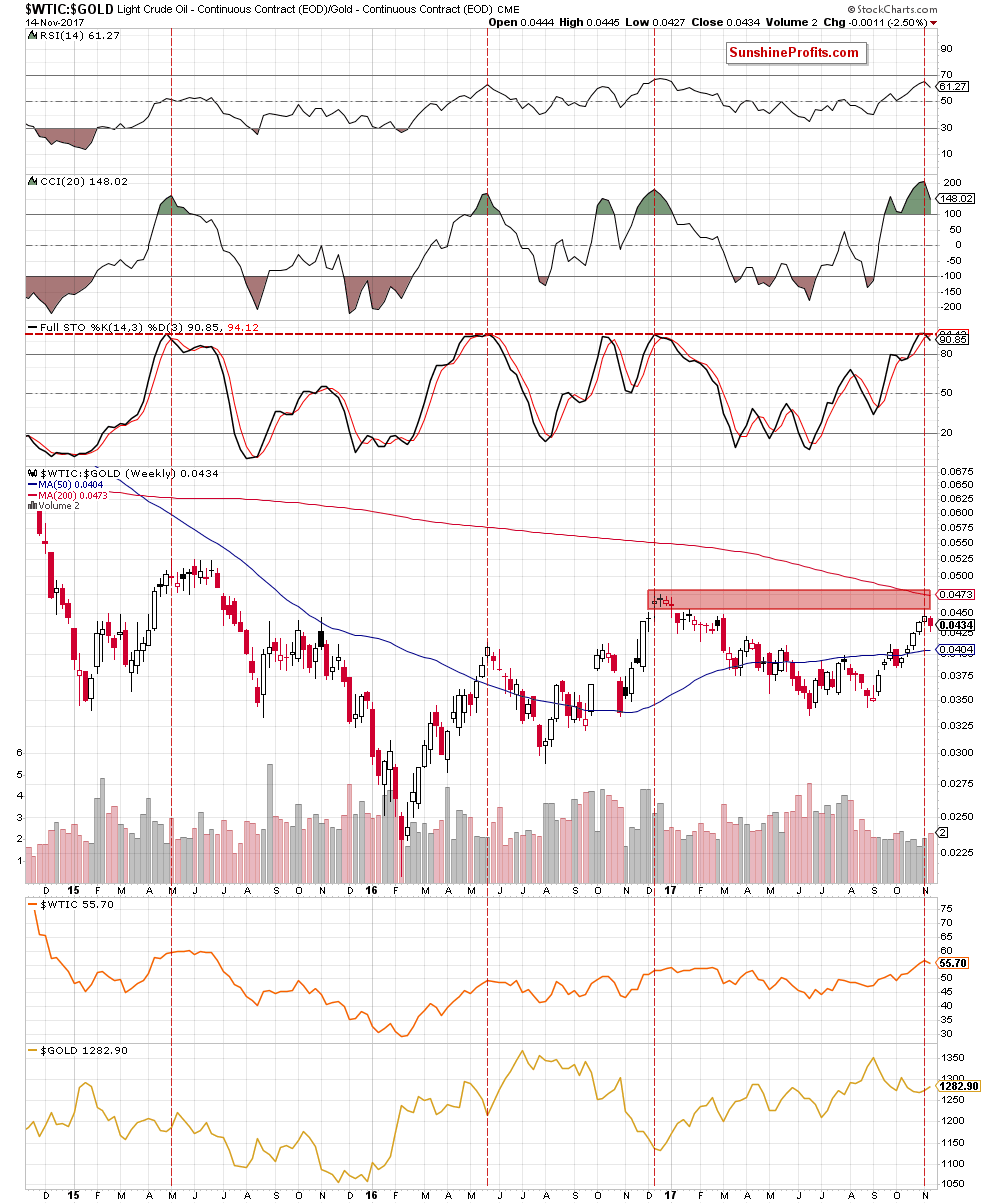
Firstly, similarly to what we wrote in the case of the long-term chart of crude oil itself, recent white candlesticks created in the previous weeks were getting smaller, which suggests that the power of buyers is decreasing and reversal in the near future should not surprise us – especially when we factor in the proximity to the red resistance zone created not only by the above-mentioned Fibonacci retracement, but also by the January highs.
Additionally, the Stochastic Oscillator generated the sell signal, giving the bears another reason to act. Since we are already here with this indicator, we would like to draw your attention to several similar situations to the current one. As you see on the above chart, there are red dashed horizontal and vertical lines marked on the indicator, which point to its highest levels since May 2015. What’s interesting in all these cases such high readings of the indicator preceded bigger moves to the downside. Therefore, in our opinion, the probability that we’ll see reversal and declines in not far future is very likely.
What does it mean for crude oil? As you see on the above charts, there is a positive correlation between the oil-to-gold ratio and crude oil which means that if it reverses and declines, it will likely translate into lower prices of crude oil in the coming week(s) – similarly to what we saw in the previous months.
Summing up, short (already profitable) positions continue to be justified from the risk/reward perspective as the technical picture of crude oil and the above-mentioned ratio suggests that reversal and lower prices of black gold are just ahead of us. Nevertheless, taking into account uncertainty around today’s government data on crude oil inventories, a short-lived upswing after the data release and a verification of the yesterday breakdown can’t be ruled out.
Very short-term outlook: bearish
Short-term outlook: mixed with bearish bias
MT outlook: mixed
LT outlook: mixed
Trading position (short-term; our opinion): Small (half of the regular size) short positions (with a stop-loss order at $61.13 and the initial downside target at $52) are justified from the risk/reward perspective. We will keep you – our subscribers – informed should anything change.
As a reminder – “initial target price” means exactly that – an “initial” one, it’s not a price level at which we suggest closing positions. If this becomes the case (like it did in the previous trade) we will refer to these levels as levels of exit orders (exactly as we’ve done previously). Stop-loss levels, however, are naturally not “initial”, but something that, in our opinion, might be entered as an order.
Thank you.
Nadia Simmons
Forex & Oil Trading Strategist
Przemyslaw Radomski, CFA
Founder, Editor-in-chief, Gold & Silver Fund Manager
Gold & Silver Trading Alerts
Forex Trading Alerts
Oil Investment Updates
Oil Trading Alerts

