

Trading position (short-term; our opinion): Short positions with a stop-loss order at $77.44 and the initial downside target at $67.95 are justified from the risk/reward perspective.
On Wednesday, crude oil lost over 5%, posting the largest daily decline since the beginning of 2018! Thanks to this price action oil bears not only hit a fresh July low, but also created a very negative combination of signals in our new ratio. Ladies and gentlemen, for the first time ever, we present the relationship between crude oil and platinum. We invite you to read today's alert.
Let’s examine the recent changes on the chart below (charts courtesy of http://stockcharts.com).
Technical Picture of Crude Oil
On Wednesday, we wrote the following:
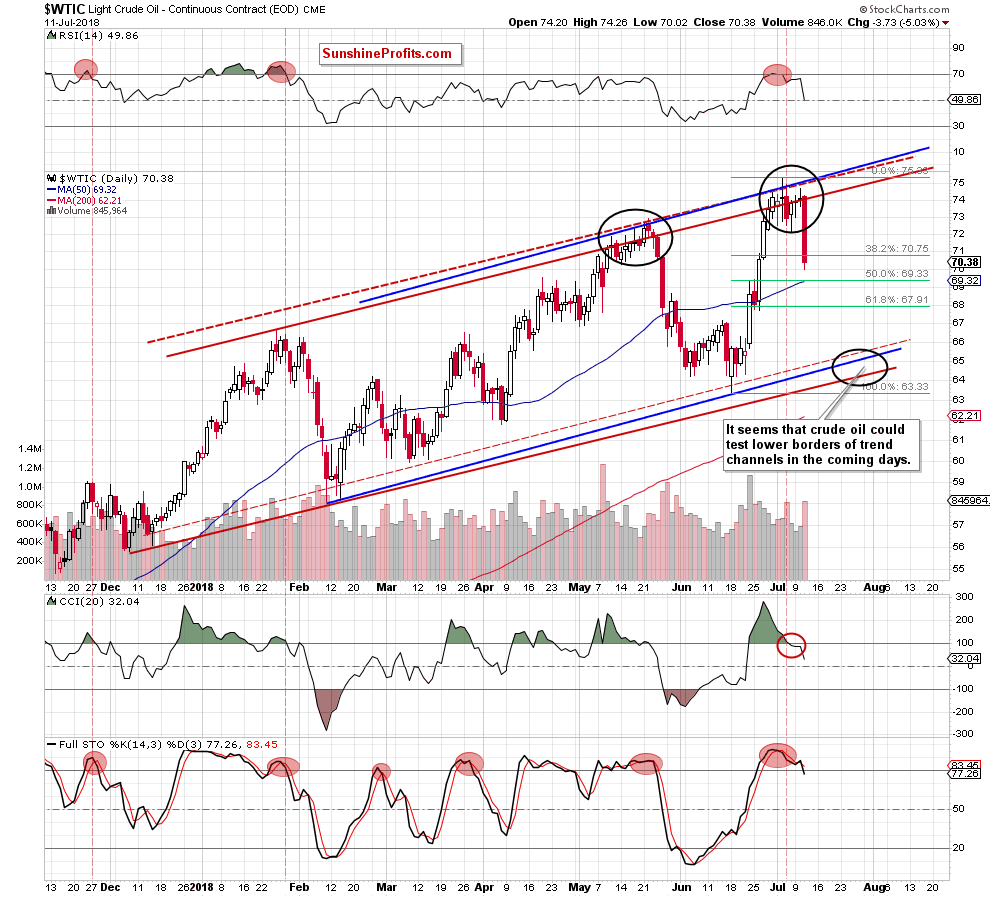
(…) black gold is still trading around the upper line of the red rising trend channel (based on intraday lows and highs).
Yesterday’s session finished several cents above it, but it’s hard to consider such price action as any success – especially when we factor in the fact that the proximity to the upper lines of the other two rising trend channels (marked with blue and red dashed lines) was enough to stimulate oil bears to act and trigger a pullback.
Additionally, the price of light crude created another doji candlestick on the daily chart, which increases uncertainty among investors about the direction of the next move. Despite this fact, all pro-declining factors about which we wrote in our previous alerts remain in the cards, supporting oil bears and lower prices of black gold in the coming days.
We also added:
(…) the current situation in crude oil is becoming more and more similar to what we could observe in May (we marked both periods with black ellipses on the above chart), because despite oil bulls’ attempts to go higher, they are not able to break above the upper borders of the blue and the red (marked with dashed lines) rising trend channels.
(…) a similar weakness in May preceded a bigger short-term downward move, which in combination with all pro-bearish signals from our previous alerts further increases the likelihood that the next significant move will be to the south.
From today’s point of view, we see that the situation developed in tune with our recent assumptions and the price of crude oil moved sharply lower during yesterday’s session, making our short positions profitable.
Thanks to yesterday’s price action, light crude broke not only below the last week’s low but also under the 38.2% Fibonacci retracement based on the entire June’s upward move, opening the way to lower levels.
Additionally, the volume increased significantly (comparing to what we saw during recent “increases”), confirming oil bears’ strength and suggesting a test of the next Fibonacci retracements in the near future. At this point, it is worth noting that the nearest support (the 50% retracement) is reinforced by the 50-day moving average, which could encourage oil bulls to stop their opponents. However, taking into account all the pro-declining factors about which we wrote in our previous alerts, we think it won’t be able to stop the sellers for long.
This scenario is also reinforced by the daily indicators, which generated the sell signals in the previous days, encouraging oil bears to act.
Finishing this part of today’s alert please note that all the above suggests that crude oil will likely drop to around $65 and test lower borders of the rising trend channels in the following days (we marked this area with the black ellipse on the daily chart).
And now, according to an earlier announcement - the relationship between oil and platinum.
Black Gold – Platinum Link
Let’s start this section with the long-term picture of this interesting relationship.
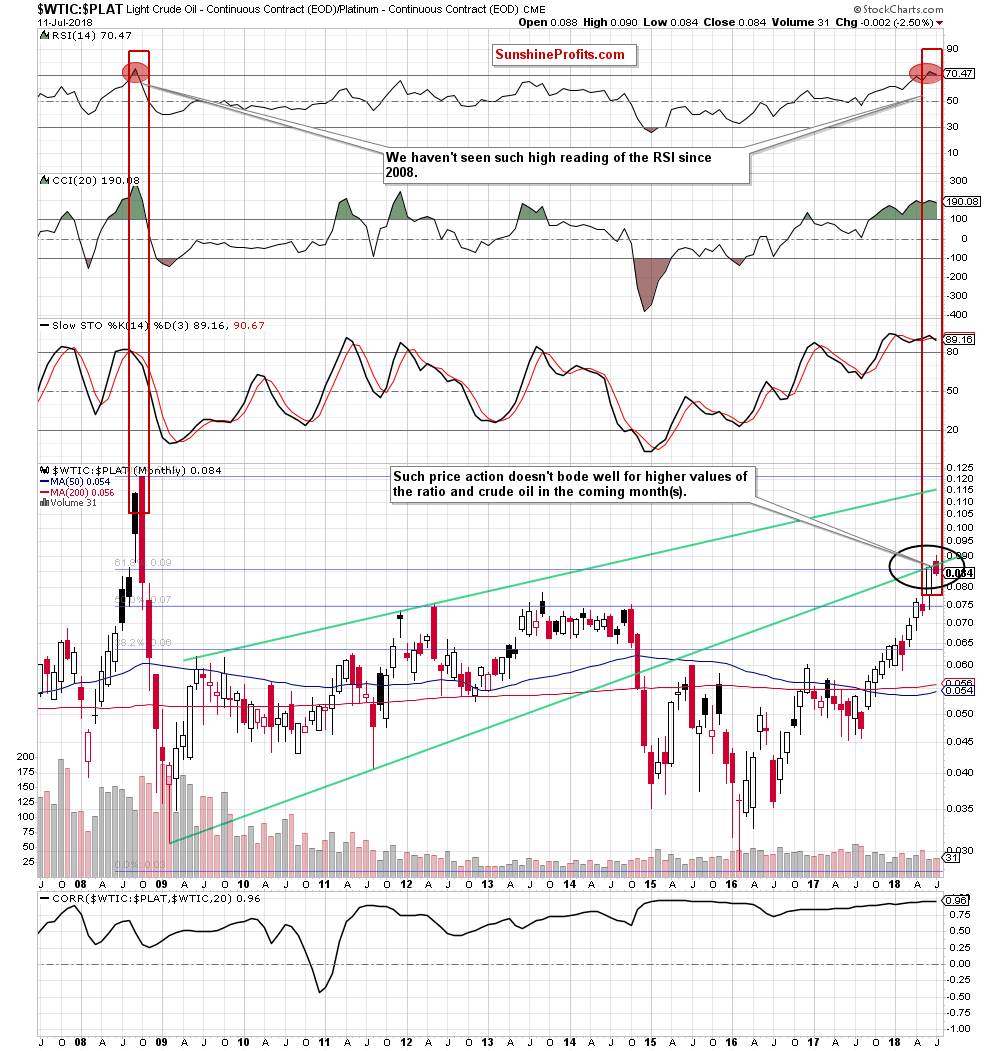
Looking at the monthly chart for the first time, you can get lost somewhat between the individual lines, rectangles and retracements. Do not worry - we'll explain everything in turn in the next paragraphs.
Let's start with the price action that we could observe in recent months.
As you see on the above chart, although the WTIC:PLAT ratio extended gains earlier this month, the previously-broken lower border of the very long-term green rising wedge stopped the buyers, triggering a pullback.
Mainly thanks to yesterday's decline, the ratio invalidated the earlier small breakout above this resistance line and the June’s high, giving the sellers one more reason to act. Additionally, thanks to this drop, the ratio also declined under the previously-broken 61.8% Fibonacci retracement, invalidating also this breakout, which doesn’t bode well for higher values of the ratio.
But what does it mean for crude oil?
When you take a look directly under the chart, you will see the current correlation between the ratio and the price of black gold in the long term. As you see, it is very high (0.96), which means (similarly to what we wrote in the case of the oil-to-gold and the oil-to-silver ratios) that further deterioration in the ratio will be also seen in the case of crude oil in the coming month(s).
Why do we think it will go down?
Firstly, all the above-mentioned invalidations of the earlier breakouts suggest that even lower values of the ratio and crude oil are just around the corner.
Secondly, the RSI climbed above the level of 70 for the first time since 2008. Back then, such high reading of this indicator preceded the biggest and the sharpest decline over the last decade. Therefore, in our opinion, if the indicator generates the sell signal, the probability that the history will repeat itself will increase significantly. At this point, it is worth noting that even if we don’t see such dramatical sale in the coming months, all short positions in crude oil should give oil bears significant profits.
Thirdly, the Stochastic Oscillator generated the sell signal, suggesting further deterioration (at least) later this month.
Fourthly, the short-term picture of the ratio and its implications.
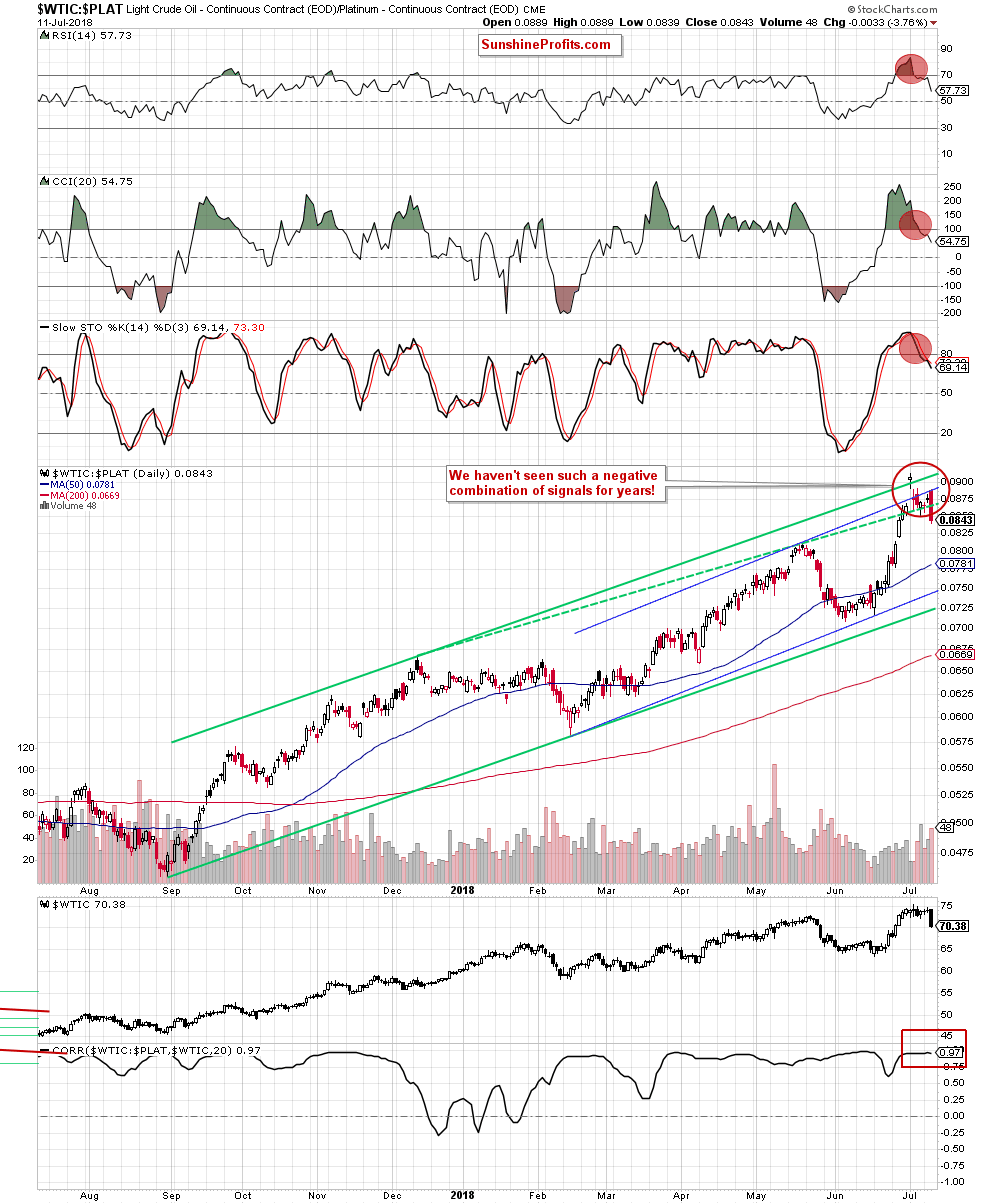
From this perspective, the first thing that catches the eye is the red ellipse around the upper border of the rising trend channels.
What does it say about the current situation? No less so than that it is very bad for oil bulls. Why? Here are the reasons.
The ratio invalidated the earlier one-day breakout above the long-term upper border of the green rising trend channel at the beginning of the month. Thanks to that price action, it also closed the gap between the last session of June and the first session of July, creating an island reversal formation.
In the above case, we can observe a bearish island reversal (above the upper border of the green rising trend channel), which started with a gap up (an exhaustion gap) followed by a series of white candlesticks. Next day, the ratio formed a gap down (a breakaway gap), which is usually expected to be followed by a bearish trend.
On the daily chart, we see that yesterday’s sharp move to the downside can be the answer to this expectation. And if this is the case, the ratio could even test the lower line of the green rising trend channel in the coming weeks.
Additionally, thanks to this month’s price action, the ratio also invalidated the earlier breakout above the upper border of the blue rising trend channel, increasing the probability of a bigger correction – especially when we factor in the fact that we saw a verification of the earlier drop under this line at the beginning of yesterday’s session (the consequences of this event speak for themselves).
On top of that, yesterday’s sharp decline invalidated also the breakout above the green dashed support line based on the previous peaks, giving the sellers extra points in the fight for lower levels.
As if all this was still not enough, all daily indicators generated the sell signals, supporting bears unanimously.
Connecting the dots, the picture that emerges from the oil-to-platinum ratio is very bearish, which significantly increases the probability of a sizable move to the downside in the coming days or maybe even weeks. Most importantly not only for the ratio, but also for black gold as very strong positive correlation between them remains in the cards (in the short term it is even a bit stronger (0.97)).
Summing up, short positions continue to be justified from the risk/reward perspective as crude oil moved sharply lower, breaking below the last week’s low and the 38.2% Fibonacci retracement. Such price action in combination with the sell signals generated by the indicators, all negative factors about which we wrote in our previous alerts and a very pro-bearish picture that emerges from the oil-to-platinum ratio suggests that further deterioration and lower prices of crude oil are just a matter of a very short time.
Trading position (short-term; our opinion): Already profitable short positions with a stop-loss order at $77.44 and the initial downside target at $67.95 are justified from the risk/reward perspective. We will keep you informed should anything change, or should we see a confirmation/invalidation of the above.
Nadia Simmons
Forex & Oil Trading Strategist
Przemyslaw Radomski, CFA
Founder, Editor-in-chief, Gold & Silver Fund Manager
Gold & Silver Trading Alerts
Forex Trading Alerts
Oil Investment Updates
Oil Trading Alerts

