

Trading position (short-term; our opinion): No positions are justified from the risk/reward perspective.
On Friday, crude oil moved sharply lower and tested the first support. Will it withstand the selling pressure and encourage oil bulls to act?
Crude Oil’s Technical Picture
Let’s take a closer look at the charts and find out (charts courtesy of http://stockcharts.com).
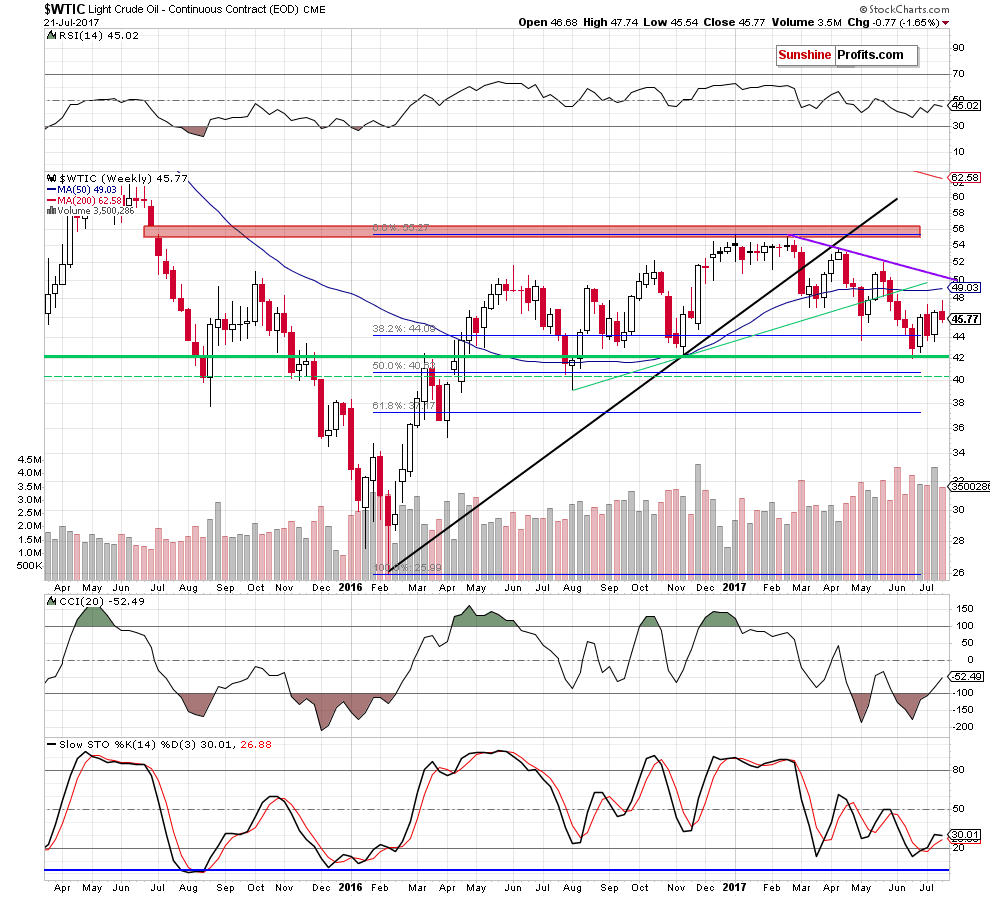
Looking at the medium-term chart, we see that the overall situation hasn’t changed much as crude oil is still trading above the 38.2% Fibonacci retracement.
Will the very short-term chart give us more clues about future moves? Let’s check.
Quoting our Friday’s alert:
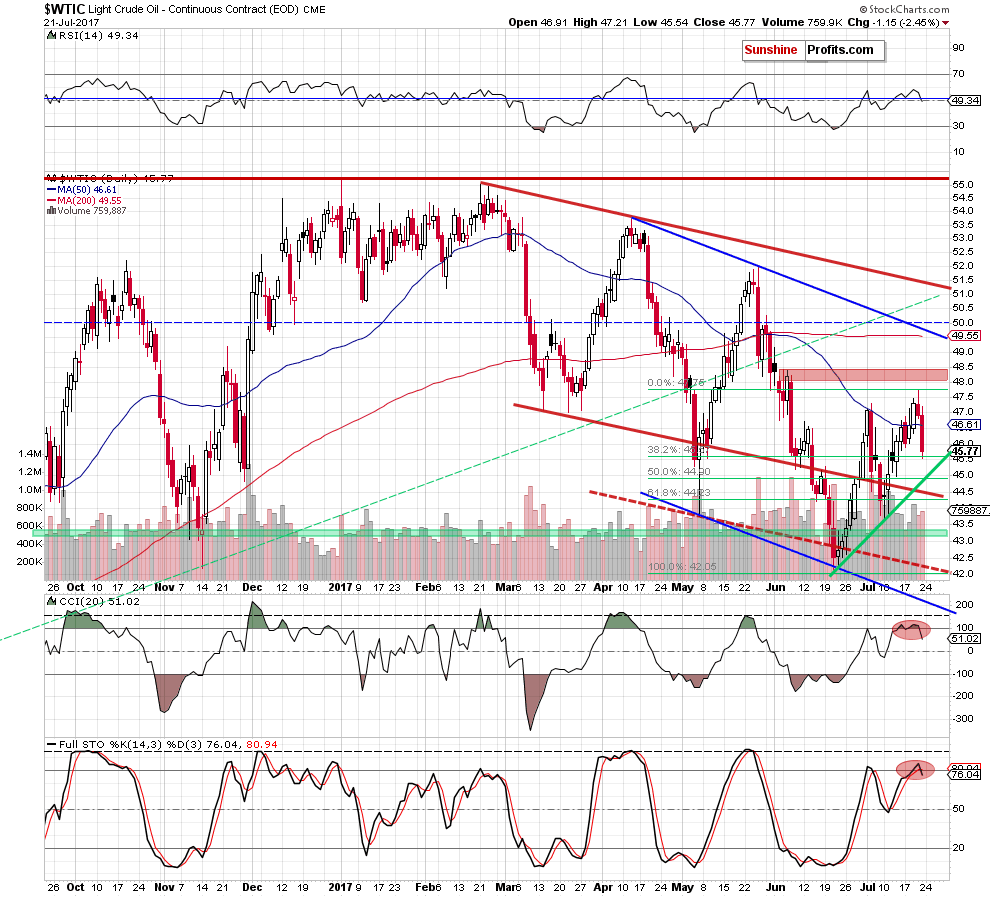
(…) although crude oil extended gains and hit an intraday high of $47.74, oil bulls didn’t manage to push the commodity higher, which resulted in a pullback. Thanks to this decline, light crude slipped under the previously-broken 50% Fibonacci retracement and the early July high of $47.32, invalidating the earlier breakouts.
What does it mean for crude oil? In our opinion, such price action is a bearish development, which suggests further deterioration. Nevertheless, another bigger move to the downside will be more likely and reliable if the black gold closes today’s session below the 50-day moving average.
From today’s point of view, we see that the situation developed in line with the above scenario and crude oil moved lower on Friday. As you see on the daily chart, the breakdown under the 50-day moving average accelerated declines, which resulted in a test of the 38.2% Fibonacci retracement based on the entire June-July upward move.
What’s next for Black Gold?
Taking into account the size of Friday’s decline, the breakdown under the 50-day moving average and the sell signals generated by the indicators, it seems that the commodity will extend declines in the coming week.
However, on the other side, the above-mentioned 38.2% Fibonacci retracement could encourage oil bulls to push light crude higher first. If this is the case, we’ll see a rebound from current level and a test of the strength of the 50-day moving average. If it holds, oil bears will receive another important reason to act (a verification of the breakdown) and we’ll likely see another move to the downside. If we see such price action, we’ll consider opening short positions.
Very short-term outlook: mixed with bearish bias
Short-term outlook: mixed with bearish bias
MT outlook: mixed
LT outlook: mixed
Trading position (short-term; our opinion): No positions are justified from the risk/reward perspective. We will keep you – our subscribers – informed should anything change.
Thank you.
Nadia Simmons
Forex & Oil Trading Strategist
Przemyslaw Radomski, CFA
Founder, Editor-in-chief, Gold & Silver Fund Manager
Gold & Silver Trading Alerts
Forex Trading Alerts
Oil Investment Updates
Oil Trading Alerts

