

Trading position (short-term; our opinion): No positions are justified from the risk/reward perspective.
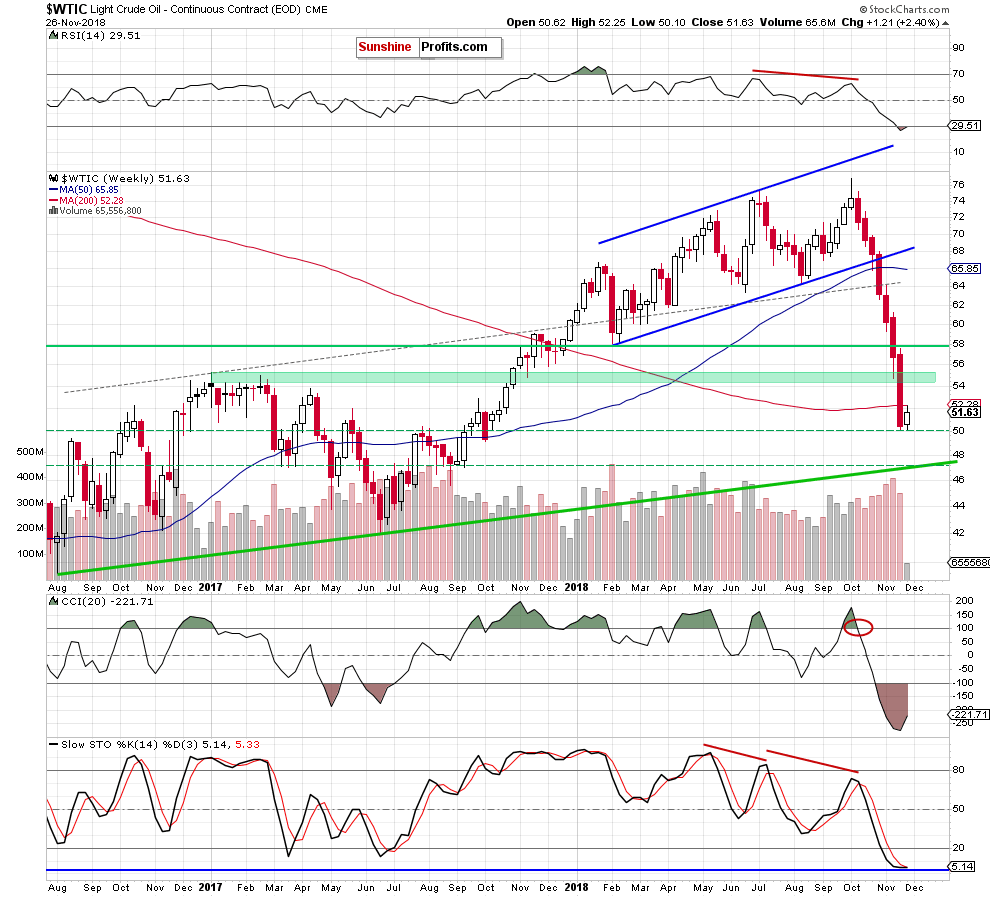
On the weekly chart (charts courtesy of http://stockcharts.com/), we see that crude oil bounced off the barrier of $50 during yesterday’s session and closed the day above $51. Although this may look encouraging, we should keep in mind that the price of black gold increased to the previously-broken 200-week moving average and pulled back, closing the day below it.
Such price action suggests that we could see nothing more than a verification of the earlier breakdown under this support. If this is the case, the price of light crude will likely move lower once again and test the recent lows, the barrier of $50 or even the support area created by the 76.4% and the 78.6% Fibonacci retracements (marked on the daily chart below with the green horizontal dashed lines) in the following days.
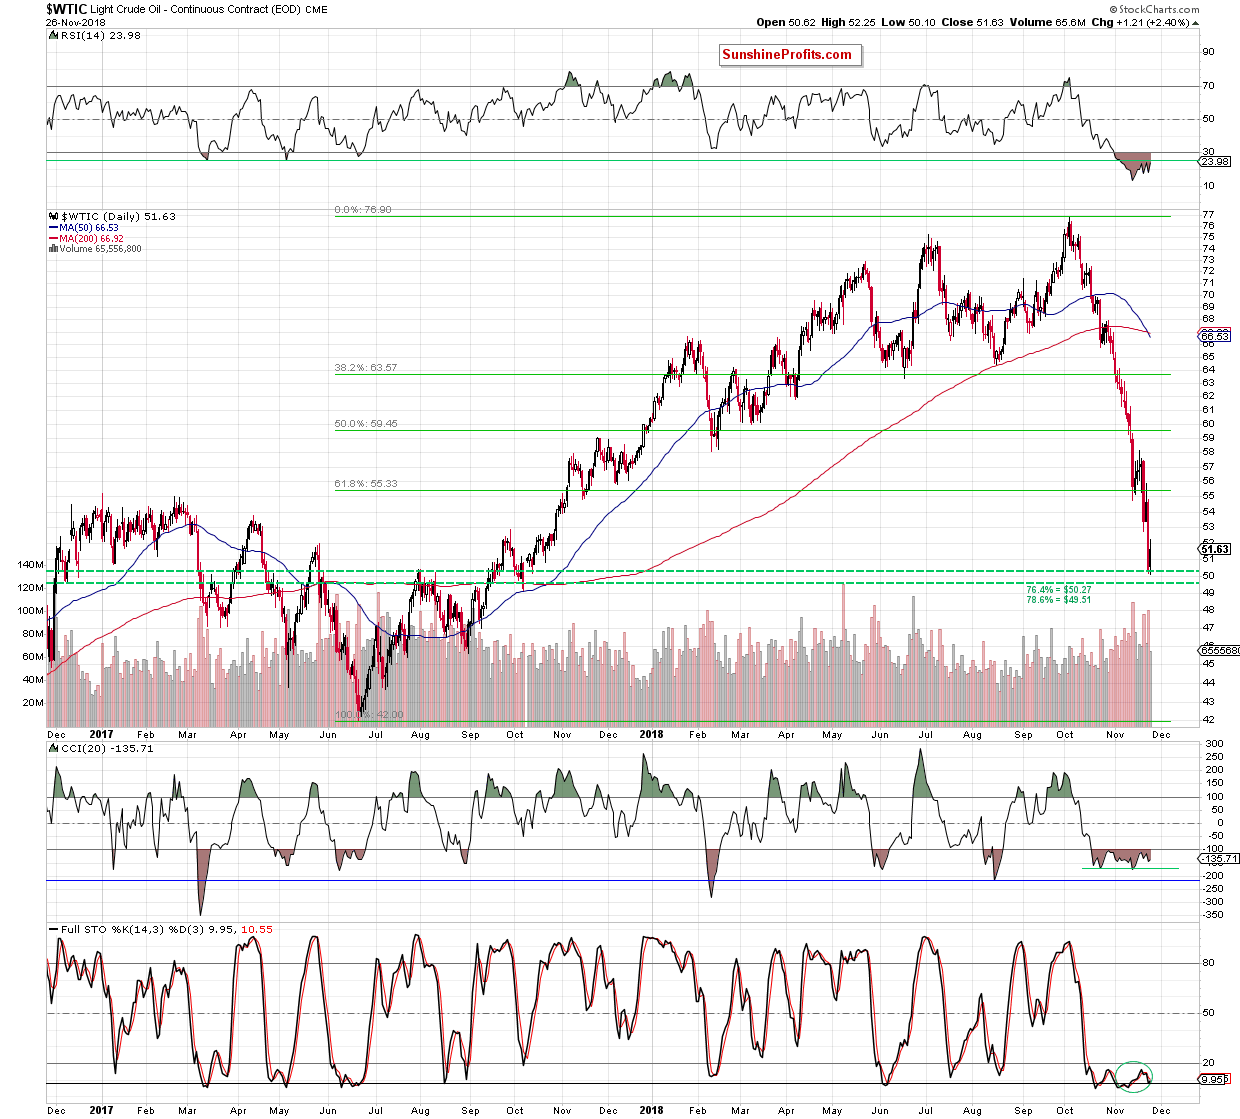
Finishing today’s commentary, please note that the current position of the daily indicators (there are bullish divergences between the RSI, he CCI and the Stochastic Oscillator and the price of the commodity) suggests that the space for declines may be limited – especially when we also factor in the position of the weekly indicators.
Nevertheless, as we mentioned earlier, one more downswing before a bigger rebound should not surprise us in the very near future. We will keep you informed should anything change, or should we see a confirmation/invalidation of the above.
Trading position (short-term; our opinion): No positions are justified from the risk/reward perspective.
Thank you.
Nadia Simmons
Forex & Oil Trading Strategist
Przemyslaw Radomski, CFA
Founder, Editor-in-chief, Gold & Silver Fund Manager
Gold & Silver Trading Alerts
Forex Trading Alerts
Oil Investment Updates
Oil Trading Alerts

