

Trading position (short-term; our opinion): Short positions with a stop-loss order at $70.96 and the initial downside target at $63.64 are justified from the risk/reward perspective.
Although oil bears pushed the price of black gold lower after yesterday’s market open, their opponents triggered a rebound. This is a repeat of what we already saw several times after April 20. When can we see reliable reversal?
Let's take a look at the daily chart below (charts courtesy of http://stockcharts.com).
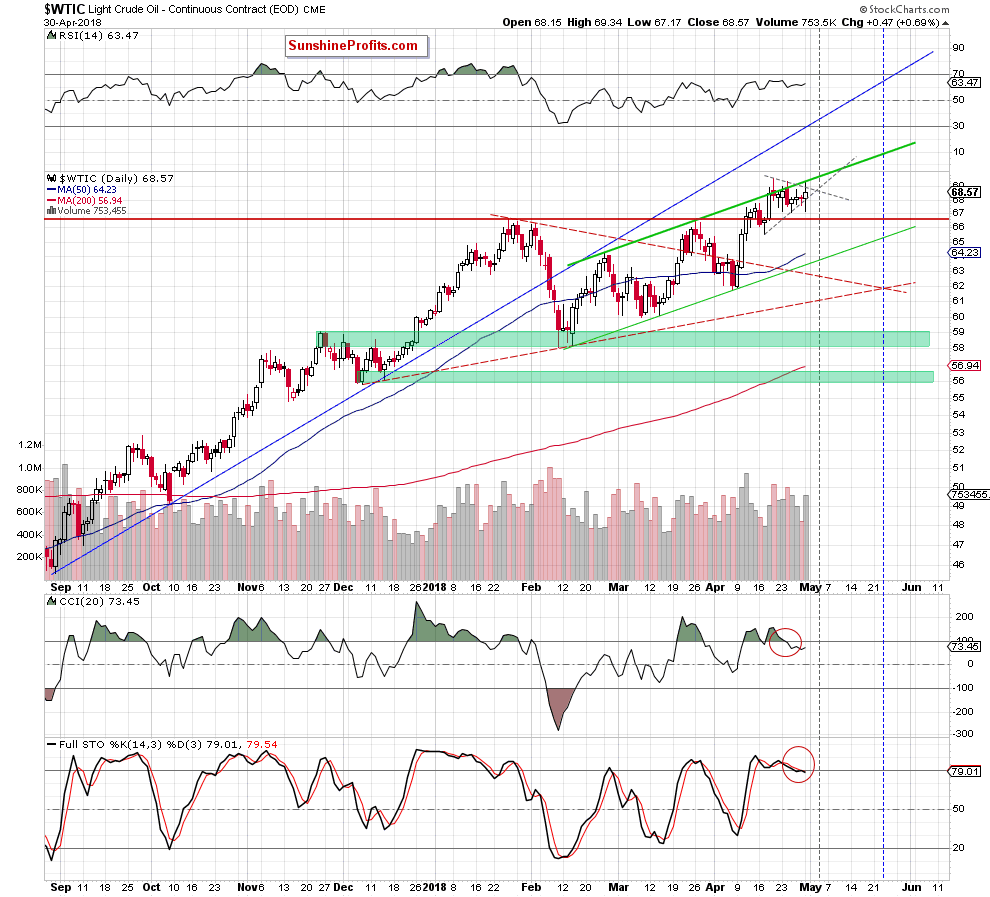
As we mentioned earlier, yesterday’s session didn’t bring a breakthrough as the forces of oil bulls and oil bears remains in a relative equilibrium. On one hand, Monday’s upswing materialized on higher volume, but on the other hand, the upper border of the green rising trend channel continues to block the way to the north and the sell signals generated by the daily indicators remain in the cards, supporting lower prices.
So why is it worth paying attention to the daily chart if so little is changing? The answer is simple – another triangle, or rather the intersection of its arms, which will take place already in the coming days (May 3rd or May 4th). As you see on the daily chart, it is created by the grey dashed resistance based on the recent highs and the grey dashed support line based on the April lows.
What does it mean for the commodity? As you know from our definition of the triangle apex reversal pattern, the intersection of the arms usually brings a reversal. Therefore, we think that the following days could finally bring such a long-awaited breakthrough.
Where will black gold head next? Taking into account the above-mentioned bearish factors and combining it with the long-term picture of light crude and the current situation in the non-USD chart of crude oil (don’t worry we will write more about these two additional factors below), we believe that the next bigger move will be to the downside and black gold will (at least) test the lower border of the green rising trend channel (currently around $63.64) in the coming month.
The Long-term Perspective
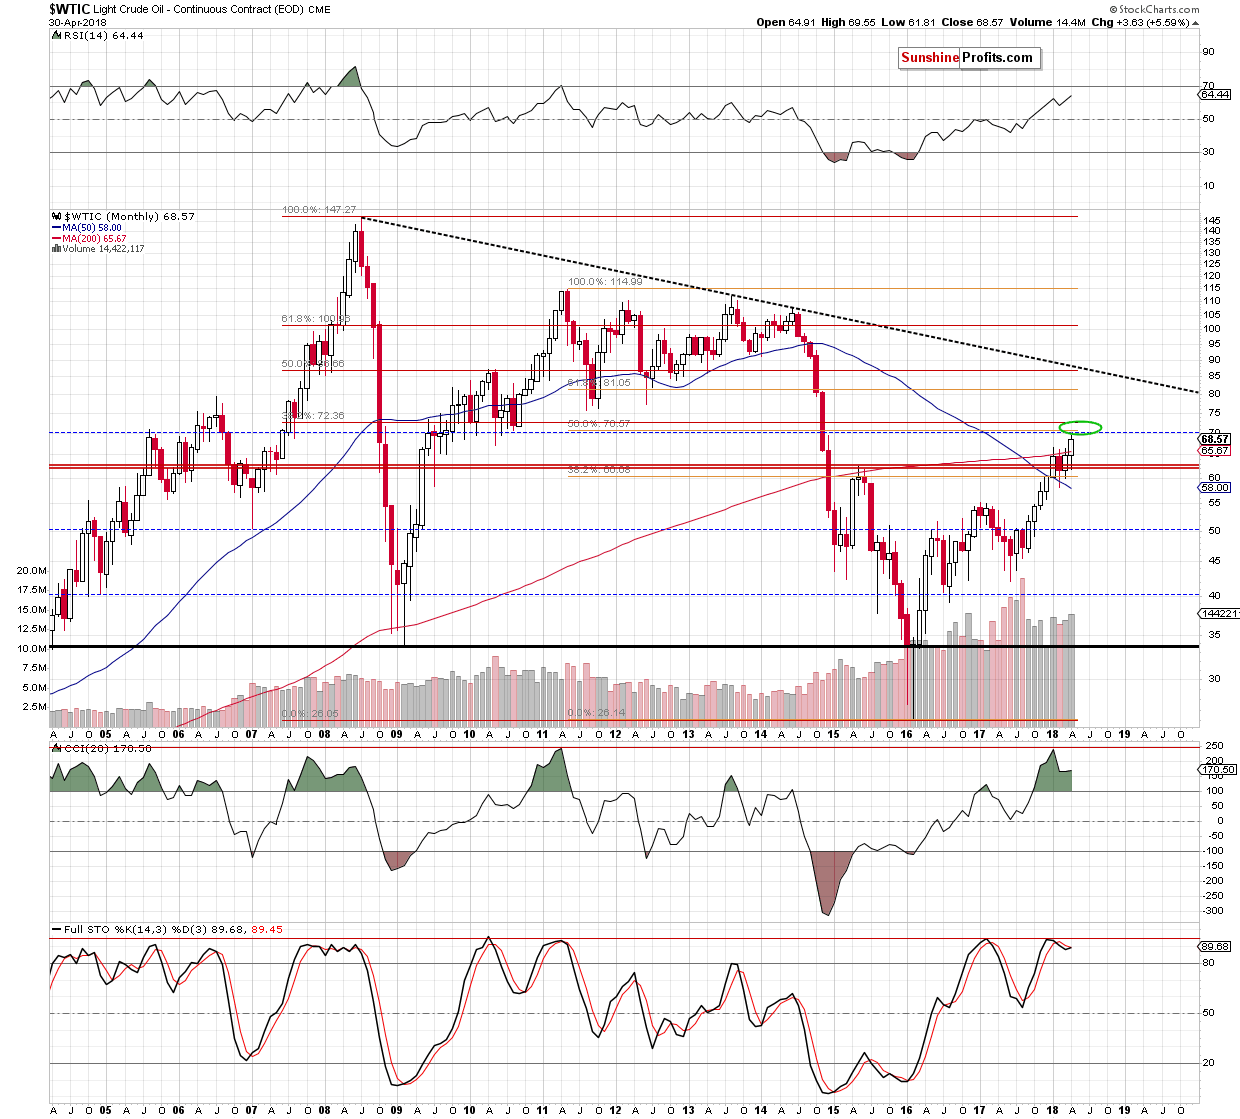
Looking at the current situation in crude oil from this perspective, we clearly see that the strong resistance area (marked with the green ellipse) created by the barrier of $70, the 50% Fibonacci retracement based on the 2011-2016 downward move and the 38.2% retracement based on the entire 2008-2016 declines continues to keep gains in check.
What impact does it have on crude oil future moves? In our opinion, this means that even if oil bulls manage to push crude oil a bit higher once again and create a fresh peak on May 3rd or May 4th the space for gains is limited and further deterioration is just around the corner.
Non-USD Perspective
Additionally, the picture, which emerges from the WTIC:UDN ratio also favors oil bears and lower prices of the commodity. Why? Let’s take a look at the long-term chart below.
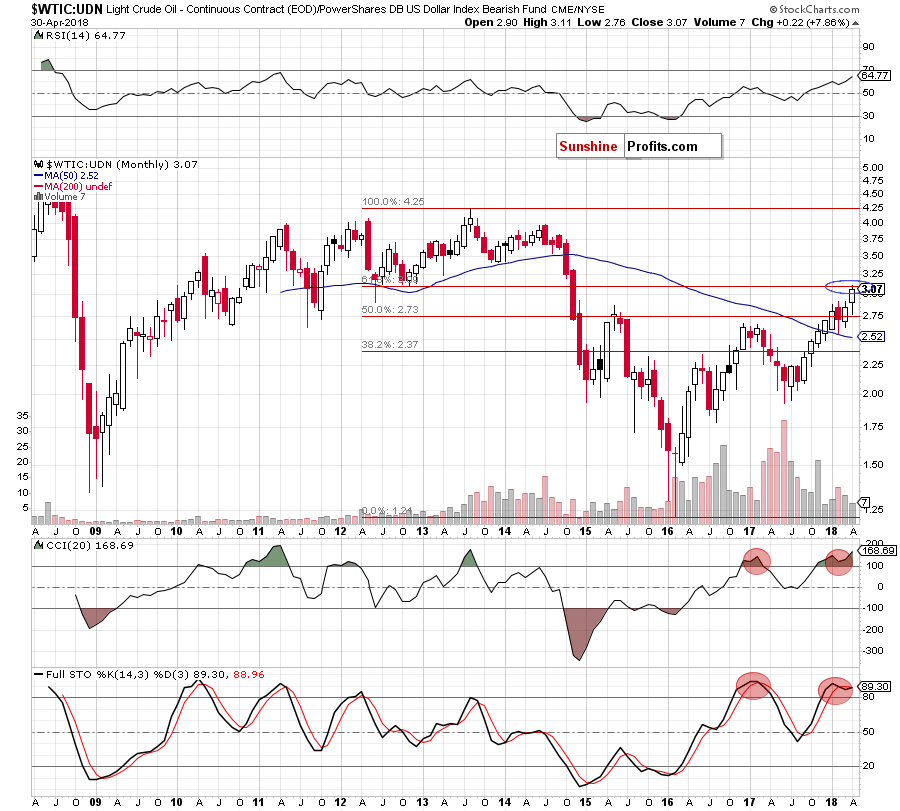
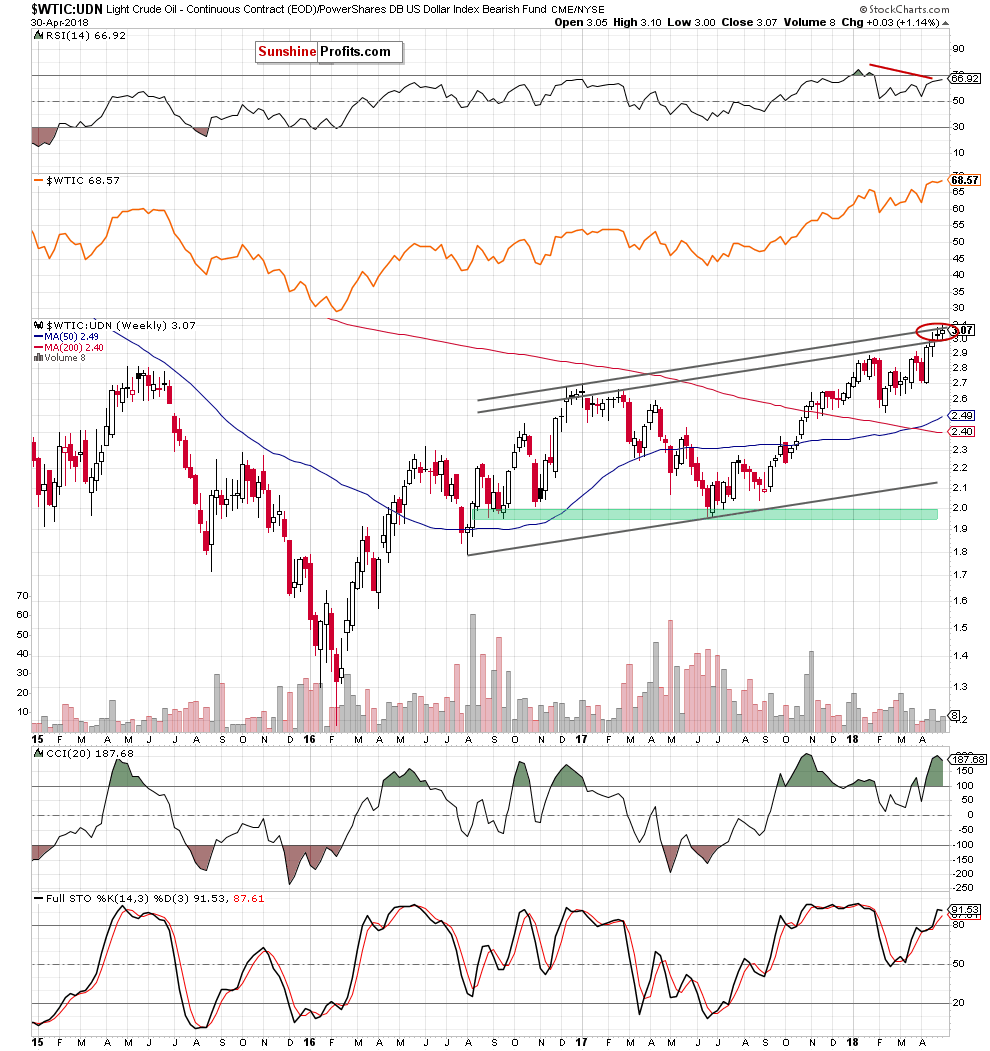
From the monthly perspective, we see that the ratio climbed to the 61.8% Fibonacci retracement (based on the entire 2013-2016 downward move), which together with the resistance area marked on the weekly chart below increases the probability of another bigger decline in the following weeks.
Connecting the dots, we continue to believe that short-positions are justified from the risk/reward perspective as the space for gains is very limited and lower prices of black gold are just a matter of time. As always, we’ll keep you - our subscribers - informed should anything change.
Trading position (short-term; our opinion): Short positions with a stop-loss order at $70.96 and the initial downside target at $63.64 are justified from the risk/reward perspective. As always, we’ll keep you - our subscribers - informed should anything change, or should we see a confirmation/invalidation of the above.
Thank you.
Nadia Simmons
Forex & Oil Trading Strategist
Przemyslaw Radomski, CFA
Founder, Editor-in-chief, Gold & Silver Fund Manager
Gold & Silver Trading Alerts
Forex Trading Alerts
Oil Investment Updates
Oil Trading Alerts

