Trading position (short-term; our opinion): No position is justified from the risk/reward perspective.
Crude oil surprised to the upside yesterday. How much of a turning point was it actually? Many of the technical headwinds persist while some have been overcome. We’ll take a look now at the most up-to-date mosaic the oil market offers us. What can we look forward for?
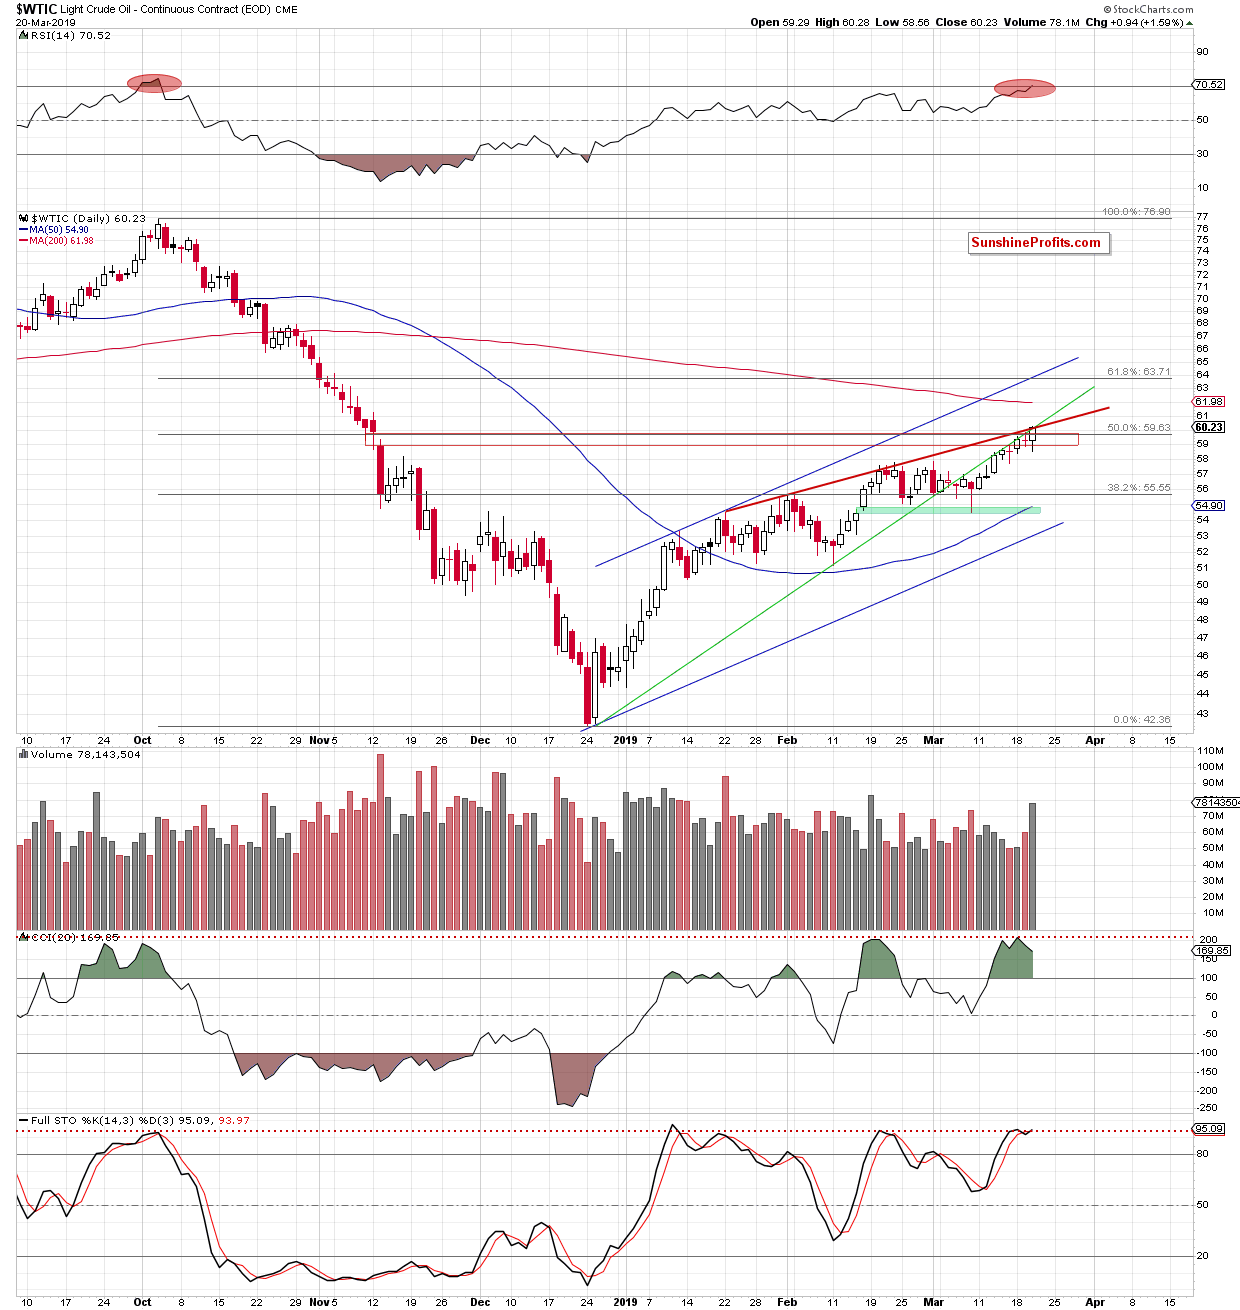
Let’s take a closer look at the chart below (chart courtesy of http://stockcharts.com).

Yesterday’s trading was quite a ride in the oil market. At first, the market was caught off guard by the surprising and pronounced decrease in U.S. crude oil inventories while expecting their slight build-up instead. Second, the Fed monetary policy and economic projections took their toll.
Crude oil hit a fresh 2019 peak and broke above the 50% Fibonacci retracement based on the entire October-December downward move. It also overcame the red resistance zone (the November price gap), which is a bullish development.
However, the medium-term green line and the red resistance line based on January and February peaks have so far not been broken and continue to keep gains in check. The RSI climbed to its highest level since the November peaks. Taking a look at the CCI and Stochastics, we see clearly visible bearish divergences between their relative positions and the accompanying price action. Together with the above-mentioned resistances, the daily indicators point in the direction of a likely reversal in a very near future.
Finally, please remember that an advance on heavy volume when faced with such formidable obstacles as described above, is not necessarily a bullish sign. Often, it’s the other way round.
Trading position (short-term; our opinion): No position is justified from the risk/reward perspective. We will keep you informed should anything change, or should we see a confirmation/invalidation of the above.
Thank you.
Nadia Simmons
Forex & Oil Trading Strategist


