

Trading position (short-term; our opinion): No positions are justified from the risk/reward perspective.
Although crude oil increased on Tuesday, breaking above upper borders of two rising trend channels, this improvement was very temporary, and the commodity closed the day under both resistance lines, invalidating the earlier breakout. Thanks to this price action something interesting appeared on the daily chart.
Let’s take a closer look at the charts below (charts courtesy of http://stockcharts.com).
Technical Picture of Crude Oil
In our last Oil Trading Alert, we wrote the following:
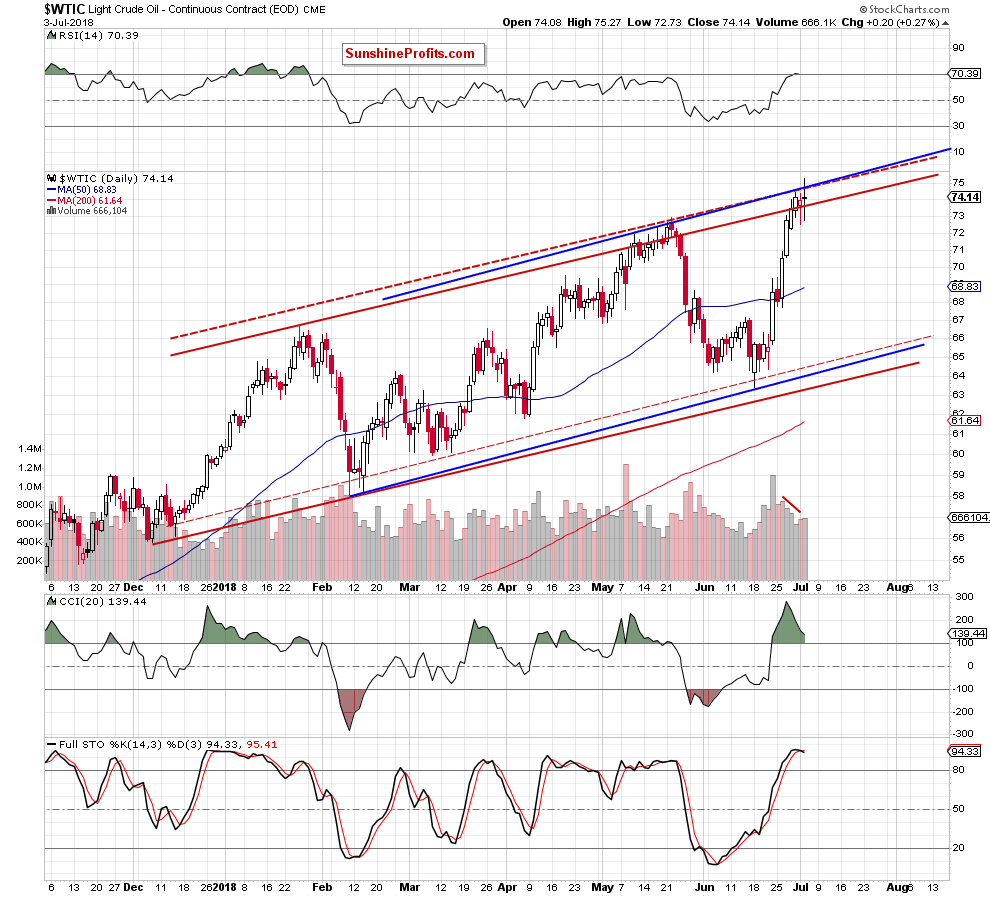
(…) crude oil moved lower after the market’s open, which took black gold below the previously-broken upper border of the red rising trend channel (created by the support line based on the December 2017 and February 2018 lows and the resistance line based on the January peak).
(…) this deterioration was only temporary, and the price of the commodity came back above this support/resistance line, invalidating the earlier breakdown.
This is a positive event, which suggests that we’ll see another attempt to move higher and a test of the upper line of the blue rising trend channel (based on the February and June lows and the May high) later in the day.
From today’s point of view, we see that although the price of crude oil broke above the upper line of the blue rising trend channel and the red dashed resistance line (the upper line of the red dashed trend channel based on daily openings), not everything went as well as bulls planned.
The buyers’ weakness just after the breakout encouraged oil bears to act, which resulted in a pullback that took the commodity below both previously-broken lines. Thanks to this invalidation of the breakout, market participants created a quite big doji candlestick, which emphasizes the investors' indecision about the direction of another move.
What’s interesting, when we take a closer look at the daily chart, we can see that although oil bulls showed strength in previous days, the candles they created in the previous week from day to day were getting smaller, which in combination with the falling volume (we wrote more about this issue in our last week’s alerts) suggested that the rally was running out of steam.
Additionally, the RSI climbed above the level of 70 (we didn’t see such high reading of the indicator since late January), the CCI deepened the bearish divergence, while the Stochastic Oscillator generated a shy sale signal.
All the above-mentioned arguments, increase the probability that further deterioration is just around the corner – especially when we factor in the proximity to the next resistance zone marked on the long-term chart below.
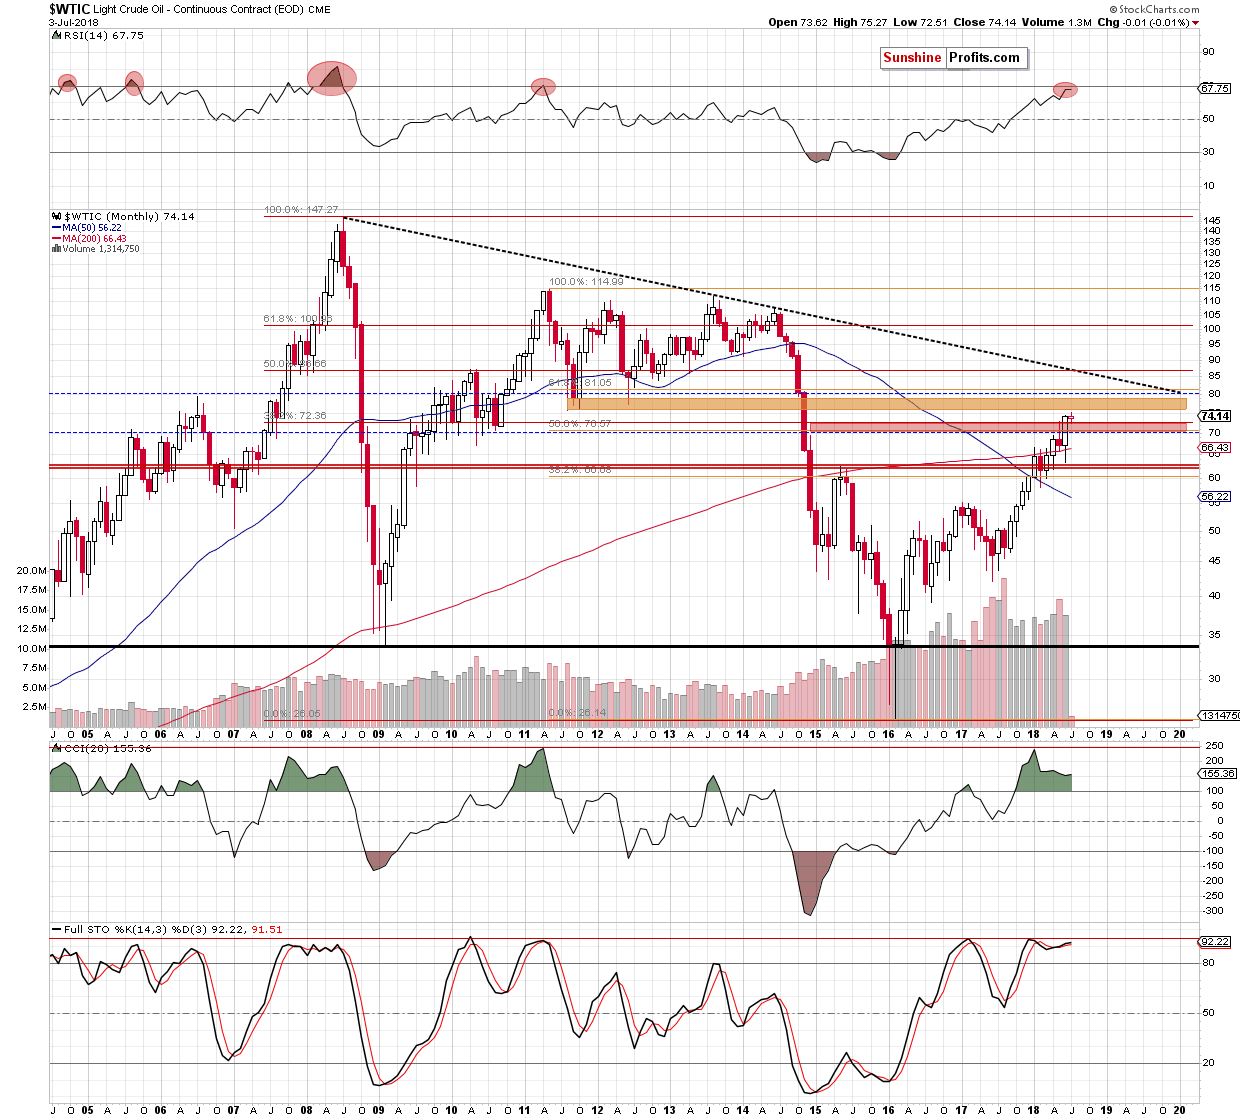
As a reminder, please keep in mind that at the level of $75.71 another resistance zone begins - this time created by the August 2011, October 2011 and June 2012 lows. The pro-bearish scenario is also reinforced by the size of volume, which declined during last month’s move to the upside.
Summing up, although crude oil increased once again on Tuesday, the proximity to the next resistance zone, the decreasing size of last week’s candlesticks, the current position of the daily indicators and the shape of the last candle seen on the daily chart, suggest that reversal and a bigger move to the downside are just around the corner.
Trading position (short-term; our opinion): No positions are justified from the risk/reward perspective, but if we see more signs of oil bulls’ weakness, we’ll consider opening short positions. We will keep you informed should anything change, or should we see a confirmation/invalidation of the above.
Thank you.
Nadia Simmons
Forex & Oil Trading Strategist
Przemyslaw Radomski, CFA
Founder, Editor-in-chief, Gold & Silver Fund Manager
Gold & Silver Trading Alerts
Forex Trading Alerts
Oil Investment Updates
Oil Trading Alerts

