

Trading position (short-term; our opinion): Long positions (with the stop-loss order at $65.10 and the initial upside target at $70.37) are justified from the risk/reward perspective.
On Thursday, black gold pulled back after Wednesday’s rally, but the size of the move suggests that oil bears may no longer be interested in lower prices of crude oil. True assumption or just a trap? Read today's alert and find out who has more technical arguments on its side and what can happen if they are skillfully used.
Let’s examine the chart below (charts courtesy of http://stockcharts.com/).
Technical Picture of Crude Oil
Quoting our yesterday’s alert:
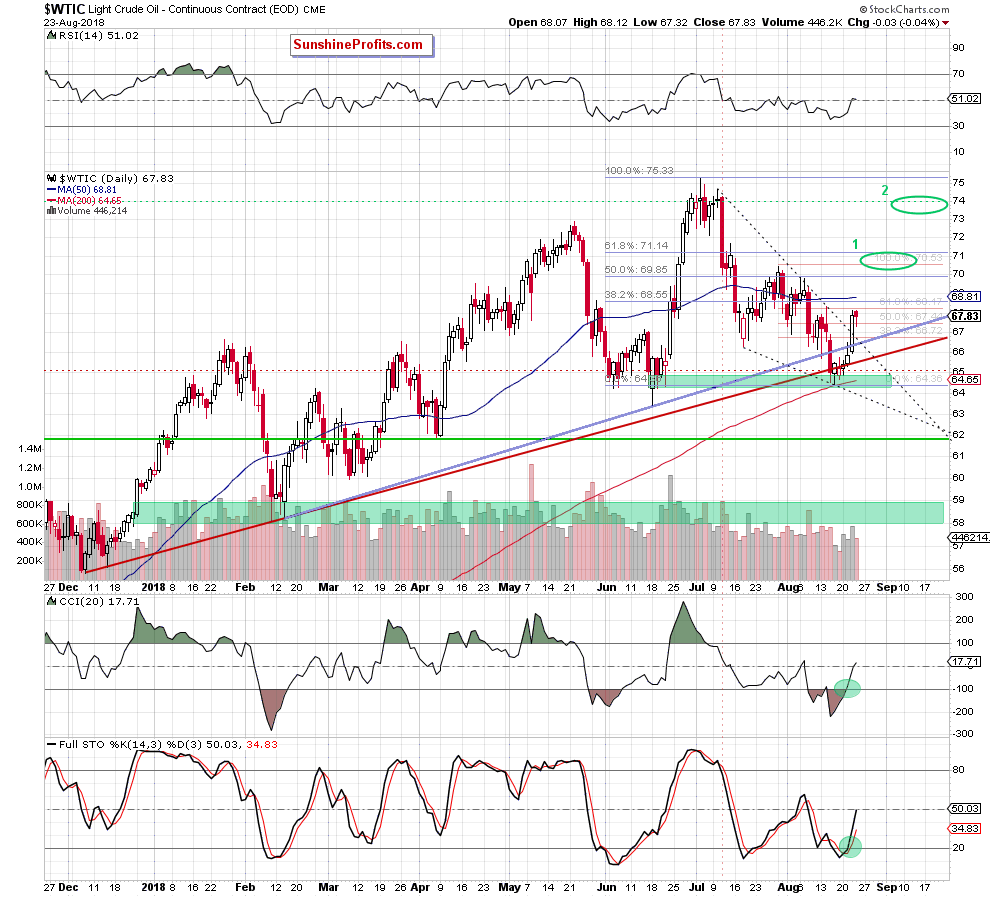
(…) the commodity broke above the 38.2% and 50% Fibonacci retracements, which approached the price to the resistance area created by the next retracement, the mid-August peak and the 38.2% Fibonacci retracement based on the entire July-August decline.
As it turned out after today’s market open, this solid resistance area was strong enough to stop the buyers and trigger a pullback, which suggests that we could see a test of the previously-broken retracements or even a verification of yesterday’s breakout above the medium-term blue line in the following days.
Looking at the daily chart, we see that the pullback was quite shallow and crude oil verified only the earlier breakout above the 50% Fibonacci retracement. After this drop, the commodity reversed and turned north once again, which suggests that oil bulls are vigilant and control the gained levels.
Additionally, yesterday’s move materialized on smaller volume than Wednesday’s upswing, which in combination with the buy signals generated by the daily indicators increases the probability that we’ll see another attempt to move higher in the very near future – maybe even later in the day or at the beginning of the coming week.
On top of that, please keep in mind that if oil bulls do not fail during today’s session, they’ll receive one more important reason to act next week. What do we mean by that?
Let’s take a look at the medium-term chart below.
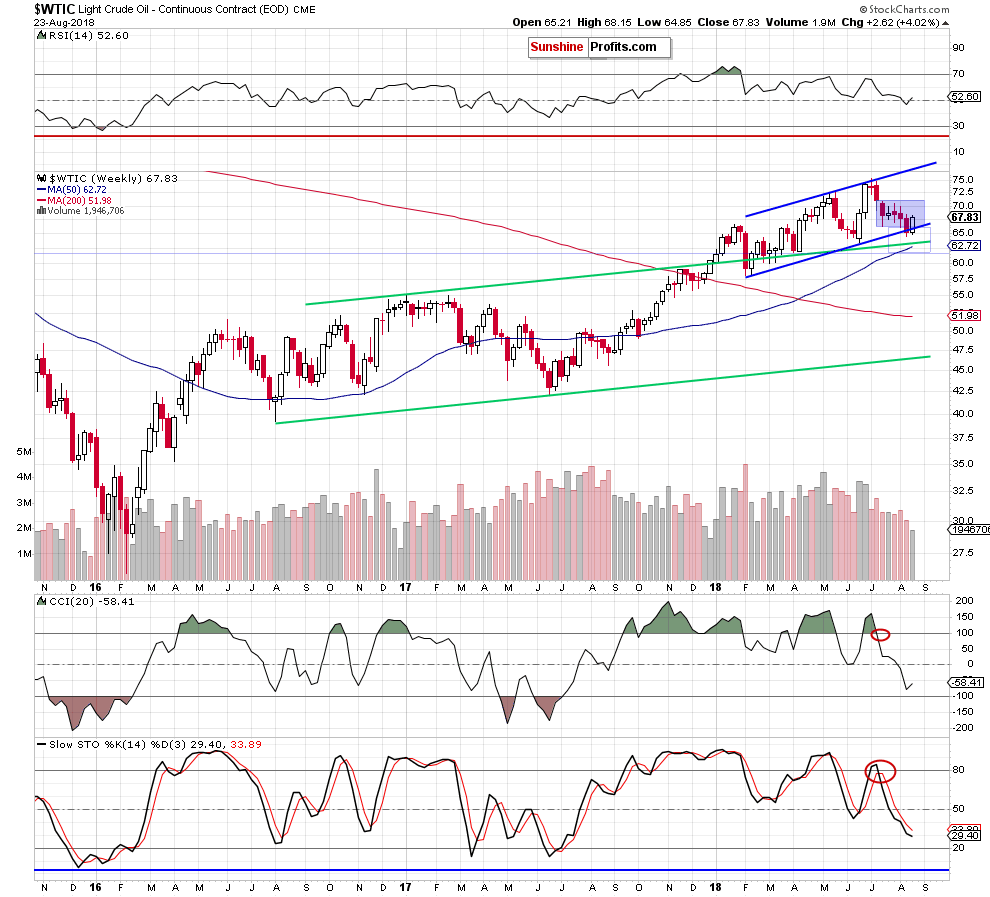
From this perspective, we see that if black gold closes this week at current levels (or higher), the commodity will invalidate the earlier breakdown under the lower border of the blue rising trend channel, which should trigger further improvement in the following days.
How high could crude oil go if we see a realization of a pro-growth scenario?
In our opinion, the first upside target will be around $70.20-$70.40, where the late July highs are (we marked this area with the green ellipse on the daily chart). Slightly above them is also the 61.8% Fibonacci retracement, which will be the next target for the buyers.
Nevertheless, if this quite solid resistance zone is broken, oil bulls could extend gains even to around $74, where the price was very often at the turn of June and July (the upper green ellipse seen on the daily chart).
Summing up, although crude oil pulled back a bit, an invalidation of the earlier breakdowns below medium-term support lines and its positive impact on the price are still in effect. Additionally, the commodity remains above the black dotted resistance line, which in combination with the medium-term picture and buy signals generated by the daily indicators suggests further improvement in the coming week. Taking all the above into account, we think that opening long positions is justified from the risk/reward perspective. All needed details you will find below.
Trading position (short-term; our opinion): Long positions (with the stop-loss order at $65.10 and the initial upside target at $70.37) are justified from the risk/reward perspective. We will keep you informed should anything change, or should we see a confirmation/invalidation of the above.
Thank you.
Nadia Simmons
Forex & Oil Trading Strategist
Przemyslaw Radomski, CFA
Founder, Editor-in-chief, Gold & Silver Fund Manager
Gold & Silver Trading Alerts
Forex Trading Alerts
Oil Investment Updates
Oil Trading Alerts

