

Trading position (short-term; our opinion): No positions are justified from the risk/reward perspective.
Strong Wednesday's rebound and return to the area of $46-$47 has awakened hope for higher prices in more than one bull. Unfortunately, yesterday's session showed that the determination of the buyers was smaller than it might seem at first glance and the price of black gold fell again below several important supports. What does it mean for the commodity?
Let’s analyze the charts below (charts courtesy of http://stockcharts.com).
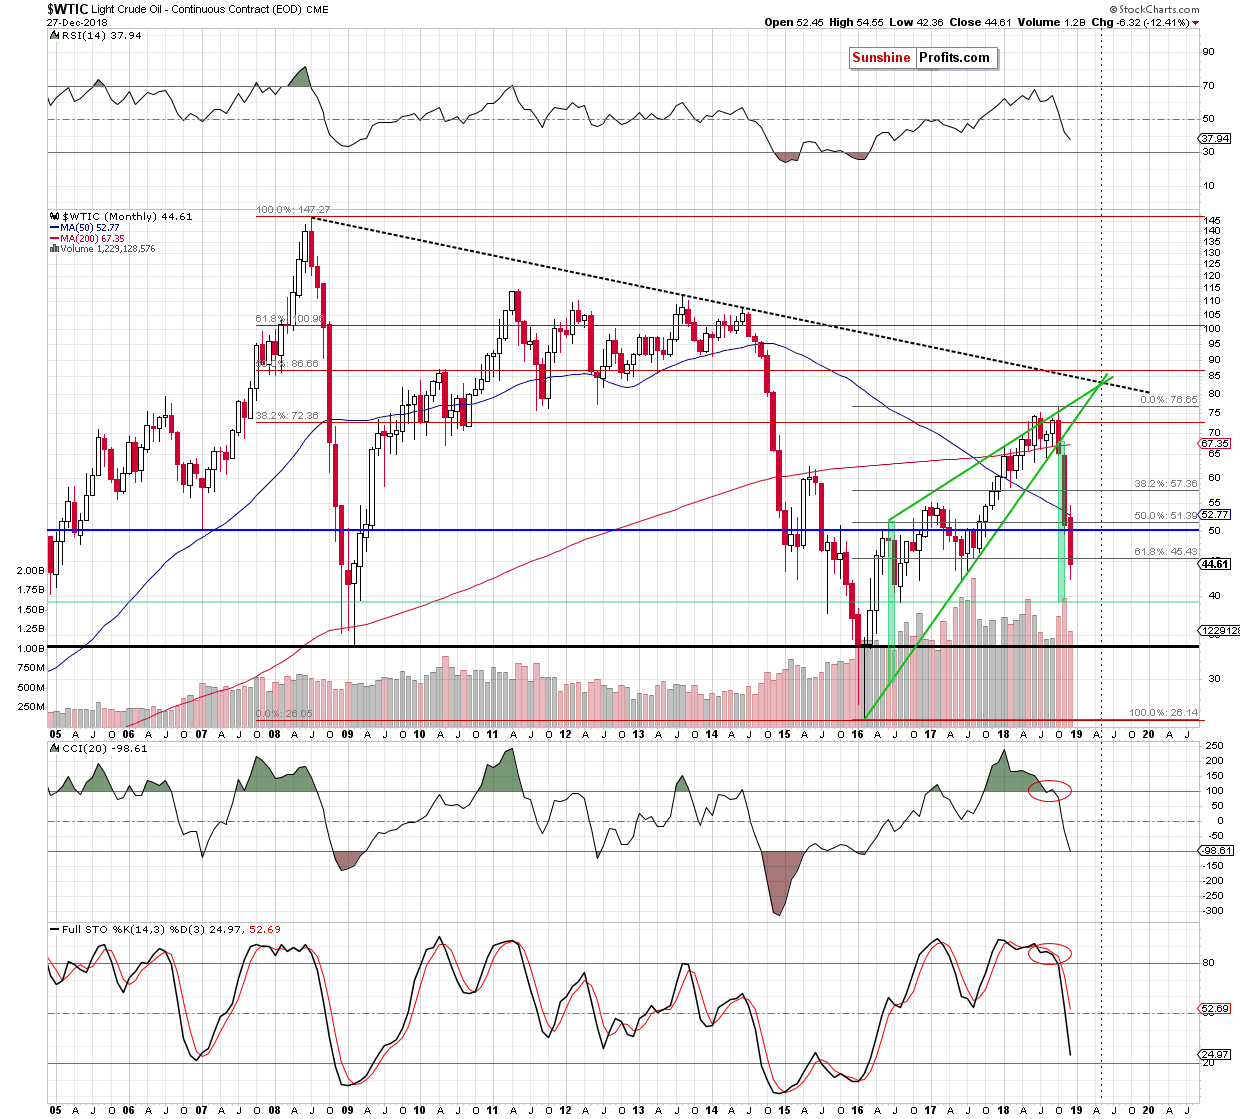
Looking at the monthly chart, we see that crude oil came back below the 61.8% Fibonacci retracement, which doesn’t bode well for the bulls during the last session of the week. Why? Because they will have to deal with additional resistance before they can think about higher levels.
Having said that, let's check what changes yesterday's session caused on the medium-term chart.
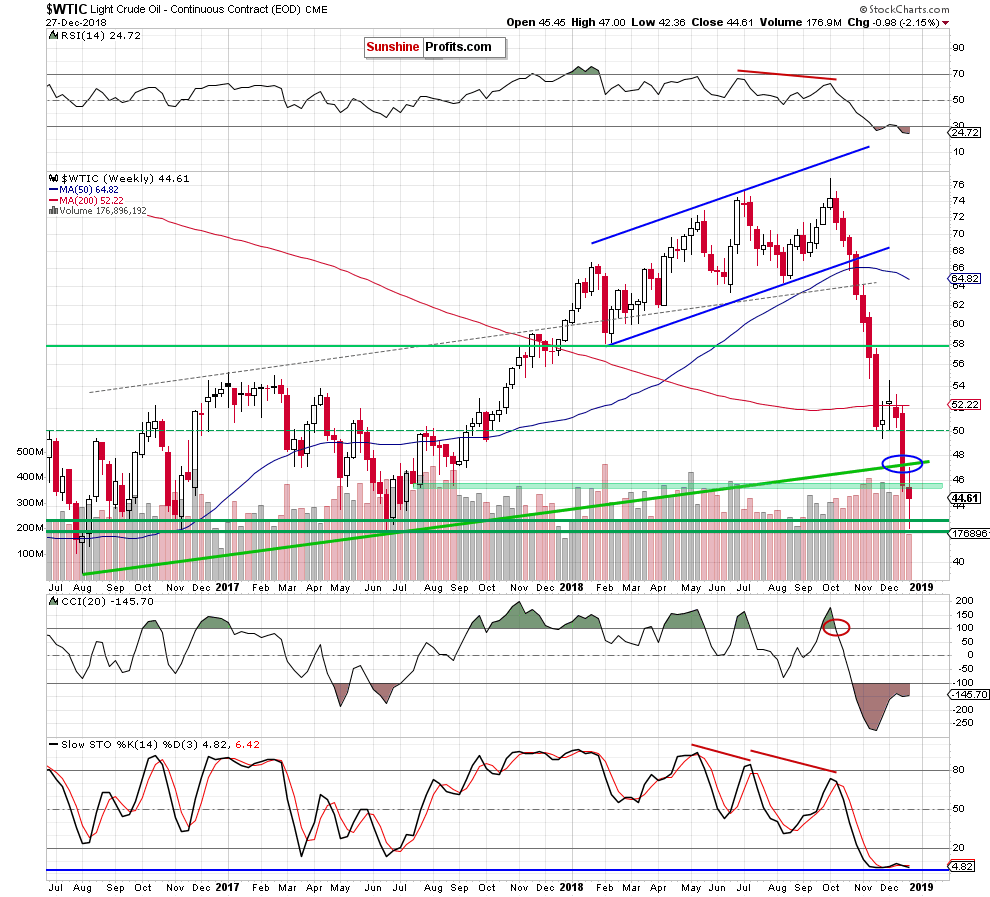
From this perspective, we also see that the future of oil bulls is not painted in bright colors, because the black gold has dived below the green support zone once again, which increases the likelihood that the bears interpreted Wednesday’s rise just like we did in our yesterday's alert:
(…) yesterday’s upswing approached crude oil to the previously-broken long-term green line, which serves as the nearest resistance at the moment. Nevertheless, there was no comeback above it, which suggests that yesterday’s move could be nothing more than just a verification of the earlier breakdown.
If this is the case and the bulls do not manage to take the price of light crude higher before today’s session closure, the probability of further deterioration will increase significantly – especially if the commodity additionally finishes the day under the green zone.
Are there any positives on the daily chart?
Before we answer this question, let's recall the quotes from yesterday's alert:
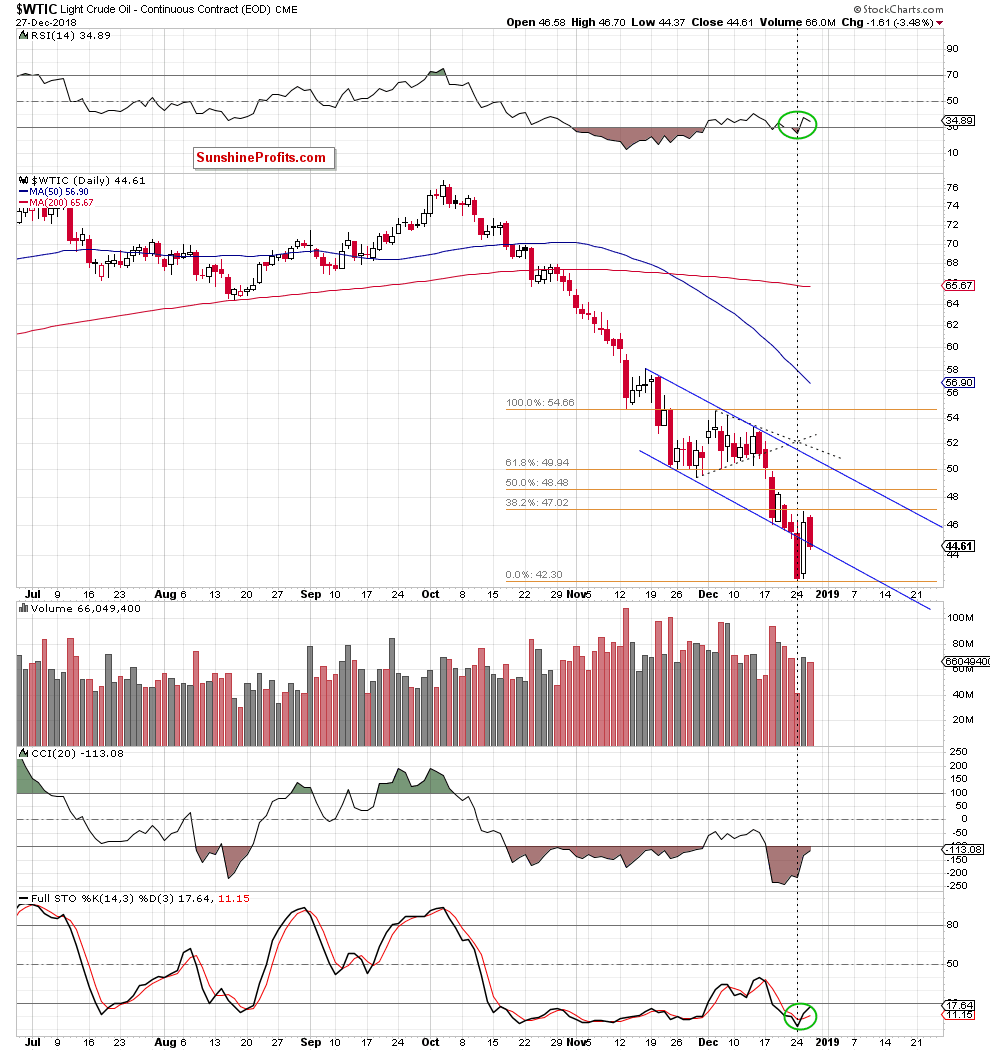
(…) the price of black gold came back above the previously-broken 61.8% Fibonacci retracement (marked on the monthly chart), the green support zone (seen on the weekly chart) and the lower border of the blue declining trend channel (marked on the daily chart below), invalidating the earlier breakdowns.
Although this is a bullish development, we should keep in mind (…) that (…) thanks to Thursday’s increase light crude climbed to the 38.2% Fibonacci retracement (based on the mid-November – late-December downward move) and then pulled back, which means that oil bears are quite active in this area.
(…) yesterday’s move materialized on quite big, but not huge volume (compared to what we saw earlier this month), which shows that fewer buyers were involved in yesterday's strong growth in black gold.
What does it mean for crude oil?
In our opinion, a verification of oil bulls’ strength. In other words, if the buyers manage to keep the price of the commodity above all levels mentioned above (the 61.8% Fibonacci retracement, the green zone, the lower border of the blue declining trend channel), during today’s and tomorrow's session the probability of a bigger correction will increase significantly - especially if the bulls manage to close the week above the long-term green rising line marked on the weekly chart.
However, if we see a deepening of yesterday's pullback or, worse, a drop below the blue declining trend channel, the road to Monday's low will be open.
From today’s point of view, we see that despite strong Wednesday's growth, the bulls failed yesterday and shortly after the session opening, they gave control on the trading floor to their opponents. As you see the bears very willingly used the weakness of buyers and took the price of black gold to the previously-broken lower border of the blue declining trend channel.
To make matters worse, the bulls allowed the sellers to close the day below this important very short-term support, which looks pretty gloomy and pro-bearish. Therefore, if the buyers do not close the ranks during today's session and fail to return to Wednesday's high (and preferably above the 38.2% Fibonacci retracement seen on the daily chart and the long-term green resistance line marked on the weekly chart), the beginning of next week will probably start in red and crude oil will (at least) test the recent and June 2017 lows.
Trading position (short-term; our opinion): No positions are justified from the risk/reward perspective. We will keep you informed should anything change, or should we see a confirmation/invalidation of the above.
Thank you.
Nadia Simmons
Forex & Oil Trading Strategist
Przemyslaw Radomski, CFA
Founder, Editor-in-chief, Gold & Silver Fund Manager
Gold & Silver Trading Alerts
Forex Trading Alerts
Oil Investment Updates
Oil Trading Alerts

