

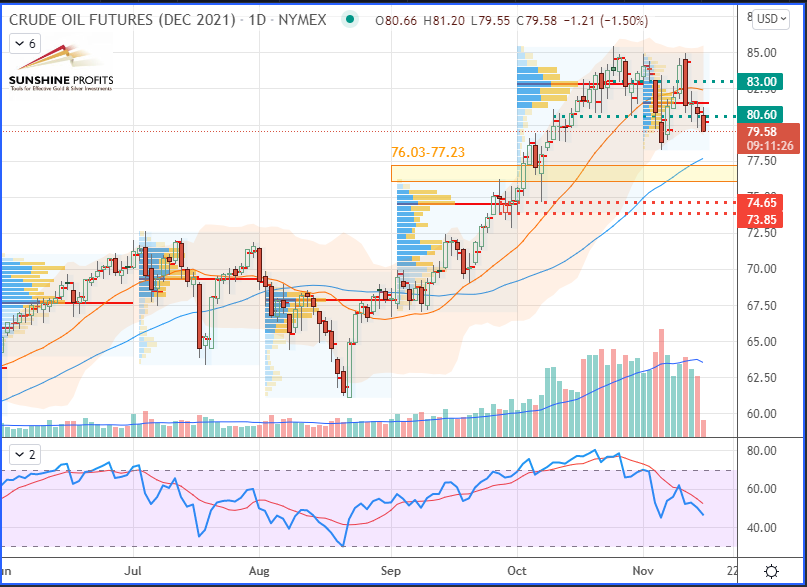
Please note that due to market volatility, some of the key levels may have already been reached and scenarios played out.
Trading position:
- WTI Crude Oil [CLZ21] Long around $76.03-77.23 support (yellow rectangle) – with stop either below $74.65 or $73.85 and targets at $80.60 and $83 – See 12-Nov edition and below chart.
- Henry Hub Natural Gas [NGZ21] No position currently justified on a risk-to-reward point of view.
What can be called a commodity currency?
Generally, a commodity currency represents a currency from a country or geographical zone that produces specific commodities which will account for the majority of its exports.
Some examples of currencies which could be considered as commodity currencies are presented in the following table:
|
Currencies |
Top Material Exports |
|
Argentine peso (ARS) |
Soybean meal ($8.81B), corn ($6.19B), delivery trucks ($3.83B), soybeans ($3.47B), soybean oil ($3.38B), bran ($292M), other vegetable residues and waste ($232M), and ground nut oil ($131M) |
|
Australian dollar (AUD) |
Iron ore ($67.5B), coal briquettes ($51.5B), petroleum gas ($34.1B), gold ($25.4B), aluminium oxide ($5.6B), sheep and goat meat ($3.07B), and wool ($2.26B) |
|
Brazilian real (BRL) |
Soybeans ($26.1B), crude petroleum ($24.3B), iron ore ($23B), corn ($7.39B), sulfate chemical wood pulp ($7.35B), poultry meat ($6.55B), frozen bovine meat ($5.67B) and raw sugar ($5.33B) |
|
Canadian dollar (CAD) |
Crude petroleum ($67.8B), cars ($40.9B), gold ($14.6B), refined Petroleum ($12.3B), vehicle parts ($10.8B), sawn wood ($6.35B), raw aluminium ($5.45B), potassic fertilizers ($5.27B), rapeseed ($3.23B), and rapeseed oil ($2.6B) |
|
Indian rupee (INR) |
Refined petroleum ($39.2B), diamonds ($22.5B), packaged medicaments ($15.8B), jewellery ($14.1B), cars ($7.15B), Rice ($6.9B), Crustaceans ($4.67B), and Non-Retail Pure Cotton Yarn ($2.86B) |
|
Indonesian rupiah (IDR) |
Coal briquettes ($20.3B), palm oil ($15.3B), petroleum gas ($8.32B), cars ($4.52B), gold ($4.01B), lignite ($2.91B), stearic acid ($2.76B), uncoated paper ($2.37B), and coconut oil ($1.9B) |
|
Malaysian ringgit (MYR) |
Integrated circuits ($63B), refined petroleum ($17.8B), petroleum gas ($11.5B), semiconductor devices ($9.65B), palm oil ($8.91B), rubber apparel ($4.37B), other vegetable oils ($1B), copper powder ($873M), asphalt mixtures ($417M), and platinum clad metals ($127M) |
|
Mexican peso (MXN) |
Cars ($53.1B), computers ($32.4B), vehicle parts ($31.2B), delivery trucks ($26.9B), crude petroleum ($26.6B), tractors ($10.7B), beer ($5.07B), tropical fruits ($3.6B), and railway freight cars ($3.57B) |
|
New Zealand dollar (NZD) |
Concentrated milk ($5.73B), sheep and goat meat ($2.62B), rough wood ($2.31B), butter ($2.29B), frozen bovine meat ($2.09B), casein ($613M), and honey ($237M) |
|
Nigerian naira (NGN) |
Crude Petroleum ($46B), petroleum gas ($7.78B), scrap vessels ($2.26B), flexible metal tubing ($2.1B), and cocoa beans ($715M) |
|
Peruvian nuevo sol (PEN) |
Copper ore ($12.2B), gold ($6.76B), refined petroleum ($2.21B), zinc ore ($1.65B), and refined copper ($1.62B), animal meal and pellets ($1.54B), lead ore ($1.01B), fish oil ($434M), and buckwheat ($139M) |
|
Russian ruble (RUB) |
Crude petroleum ($123B), refined petroleum ($66.2B), petroleum gas ($26.3B), coal briquettes ($17.6B), wheat ($8.14B), semi-finished iron ($6.99B), coal tar oil ($4.49B), raw nickel ($4.03B), and nitrogenous fertilizers ($3.05B) |
|
South African rand (ZAR) |
Gold ($16.8B), platinum ($9.62B), cars ($7.61B), iron ore ($6.73B), and coal briquettes ($5.05B), manganese ore ($3.16B), chromium ore ($1.92B), titanium ore ($583M), and niobium, tantalum, vanadium, and zirconium ore ($480M) |
|
Swiss franc (CHF) |
Gold ($59B), packaged medicaments ($46.2B), blood, antisera, vaccines, toxins, and cultures ($32.9B), base metal watches ($13.6B), jewellery ($10.9B), precious metal watches ($7.32B), and hydrazine or hydroxylamine derivatives ($501M) |
|
US dollar (USD) |
Refined petroleum ($84.9B), crude petroleum ($61.9B), cars ($56.9B), integrated circuits ($41.4B), vehicle parts ($41.2B), medical instruments ($29.5B), gas turbines ($28.1B), aircraft parts ($16.3B), and orthopedic appliances ($12.1B) |
|
Vietnamese dong (VND) |
Broadcasting equipment ($42.3B), telephones ($18.2B), integrated circuits ($15.5B), textile footwear ($10.6B), and leather footwear ($6.43B), coconuts, Brazil nuts, and cashews ($3.16B), fuel wood ($2.05B), cement ($1.39B), metal-clad products ($1.37B), and cinnamon ($175M) |
|
West African CFA franc (XOF) |
Gold ($11.66B), cocoa beans ($3.84B), refined petroleum ($2.64B), rubber ($1.08B), raw cotton ($1.04B), and crude petroleum ($941M), cocoa paste ($795M), other oily seeds ($407M), Phosphoric Acid ($346M), coconuts, Brazil nuts, and cashews ($280M), ground nuts ($192M), zinc ore ($173M), raw zinc ($155M), electricity ($141M), cocoa shells ($115M), calcium phosphates ($95.7M), radioactive chemicals ($59.6M), rough wood ($59.5M), raw copper ($49.4M), Petroleum Gas ($42.5M), non-fillet frozen fish ($356.1M), other vegetable residues ($25.4M), and aluminium ore ($3.17M) |
Data: The Observatory of Economic Complexity (OEC)
(Bold: products which the country/economic area was the world’s biggest exporter in 2019)
For active trading purposes, the ones underlined would actually be characterised as freely floating and more liquid currencies. Thus, they would also be more accessible and less costly (with lower fees) to trade.
For hedging purposes, the others would present some advantages to the commercialisation of their associated natural resources, even though they would rather be considered more exotic currencies.
Charts:
Here is a representation of some key commodity currencies presented in the above table on a weekly timeframe against the US dollar (reference currency):
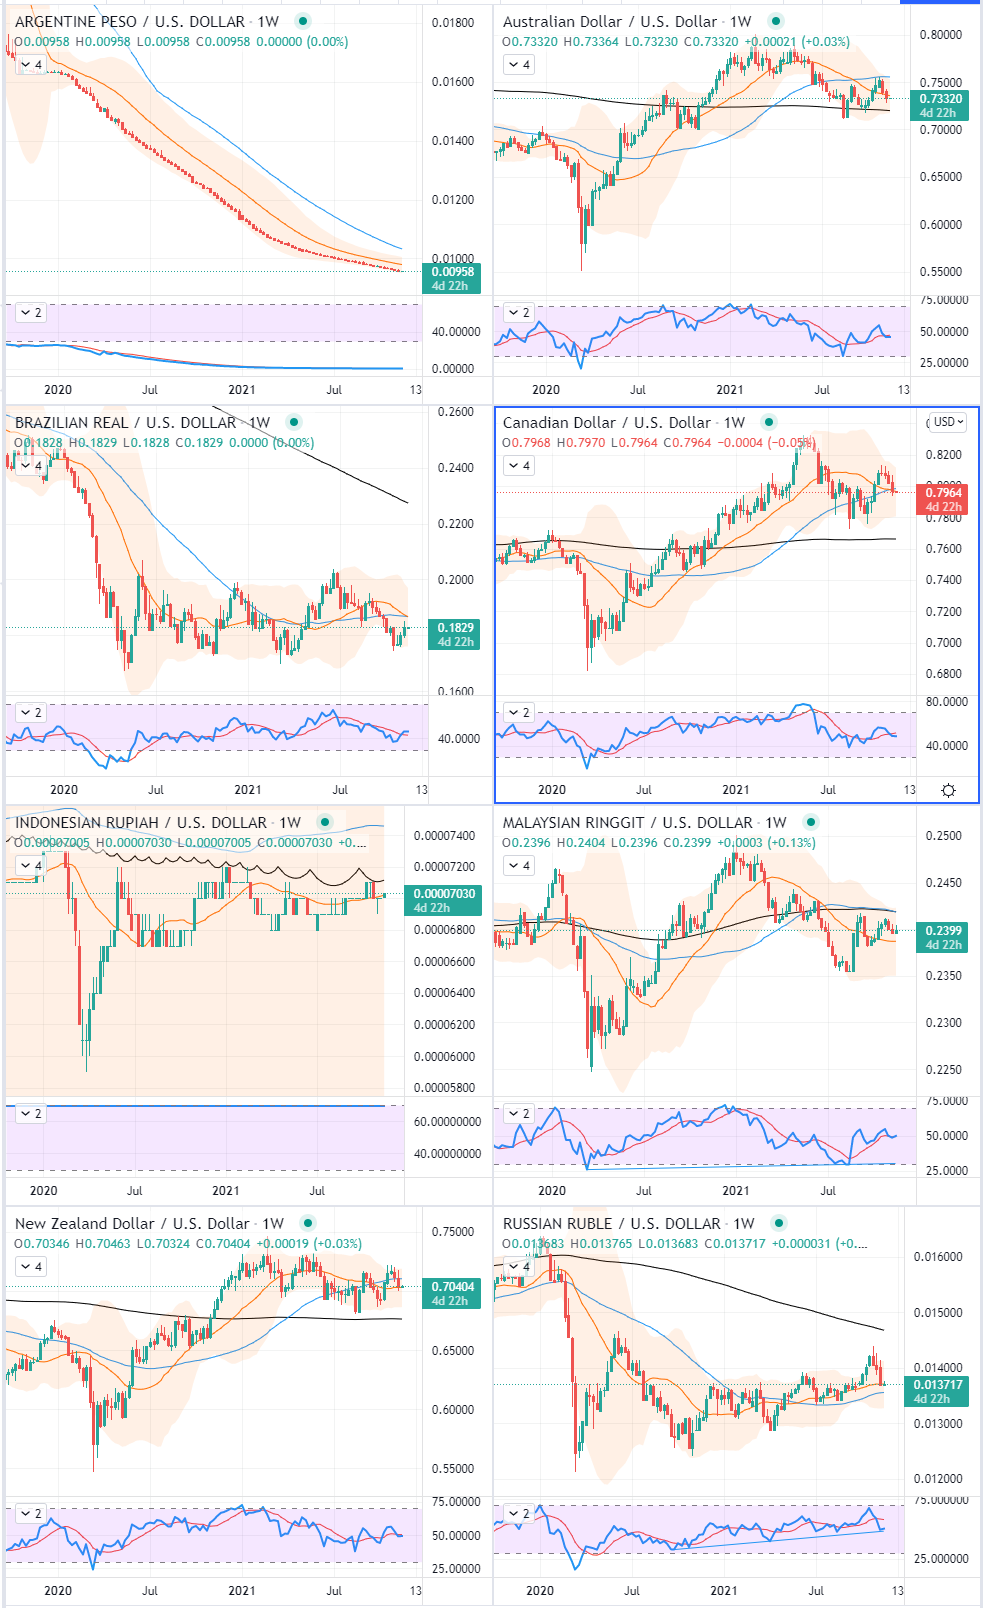
Each chart was represented within 2-standard deviation Bollinger Bands based on a 20-period simple moving average (in orange), a 50-period simple moving average (blue curve), a 200-period simple moving average (the black curve) and in the pane below is a 14-period relative strength index (in blue) to which was applied a 9-period simple moving average (red curve).
All those charts are displayed over a 2-year historical period.
In the next article I’ll focus on highlighting some correlations which may exist between key natural resources and the currencies in which they are usually traded.
As always, we’ll keep you, our subscribers well informed.
Please note that due to market volatility, some of the key levels may have already been reached and scenarios played out.
Trading position:
- WTI Crude Oil [CLZ21] Long around $76.03-77.23 support (yellow rectangle) – with stop either below $74.65 or $73.85 and targets at $80.60 and $83 – See 12-Nov edition and below chart.
- Henry Hub Natural Gas [NGZ21] No position currently justified on a risk-to-reward point of view.
Thank you.
Sebastien Bischeri
Oil & Gas Trading Strategist

