

Trading position (short-term; our opinion): Short positions with a stop-loss order at $70.96 and the initial downside target at $62.85 are justified from the risk/reward perspective.
At the first glance, Friday session didn’t bring anything new and we could summarize it in one or two sentences. Nevertheless, often when it seems that everything (or almost everything) has already been described, something surprising and fresh appears, which may contribute to increases in profits in the future. What interesting did we discover this time and how can it effect your gains?
Technical Analysis of Crude Oil
Let's examine the charts below (charts courtesy of http://stockcharts.com).
From today’s point of view, we see that although crude oil extended losses after the Friday’s market’s open, oil bulls stopped the sellers halfway to $67. Thanks to their intervention, black gold rebounded and closed the day almost $1 higher than an intraday low of $67.49. But can we treat this rebound as a bullish development?
In our opinion, we can’t. Why? We have 6 reasons, which confirm our assumption.
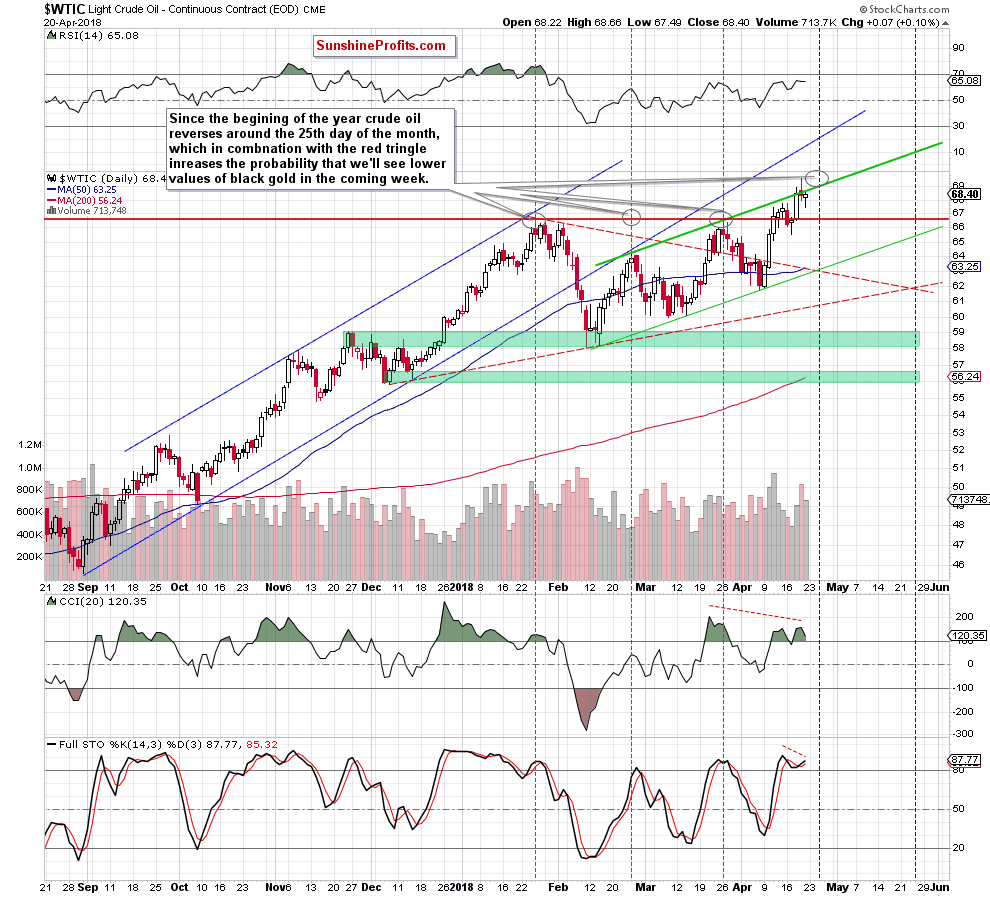
First, although the commodity moved higher on Friday, oil bulls didn’t manage to break above the upper border of the green rising trend channel, which resulted in a tiny pullback before the session’s closure. This means that an invalidation of the earlier breakout and its potential negative impact on the price of light crude remain in effect, supporting the sellers and another attempt to move lower.
Second, as you see on the daily chart, Friday’s upswing materialized on smaller volume than Thursday’s decline, which raises some doubts about the buyers’ strength.
Third, despite the above-mentioned rebound, bearish divergences between the CCI, the Stochastic Oscillator and black gold remain in the cards, suggesting another downswing in a very near future – especially when we factor in the fact that both indicators stay in their overbought areas, which increases the probability of the sell signals in the coming week.
Fourth, when we take a closer look at the daily chart, we can notice the red triangle (marked with red dashed lines) created by the resistance line based on the January and February peaks and the support line based on the December and February lows. What does this formation can tell us abut crude oil’s future moves? Not much than this that the above-mentioned lines will cross on April 25 or April 26. In other words, we can see another triangle apex reversal in the coming days.
Speaking about these dates… we analyzed the daily chart in terms of reversals and we discovered something interesting. As you see on the above chart, all earlier 2018 peaks were created around the 25th day of the month. We noticed a reversal on January 25, February 26 and March 26. Is that a quinsidence? Maybe, but quite regular and supported by many other technical factors, which increases the probability that the history will repeat itself once again in the very near future.
And what is the next pro-bearish factor? We can see it more clearly on the long-term chart below.
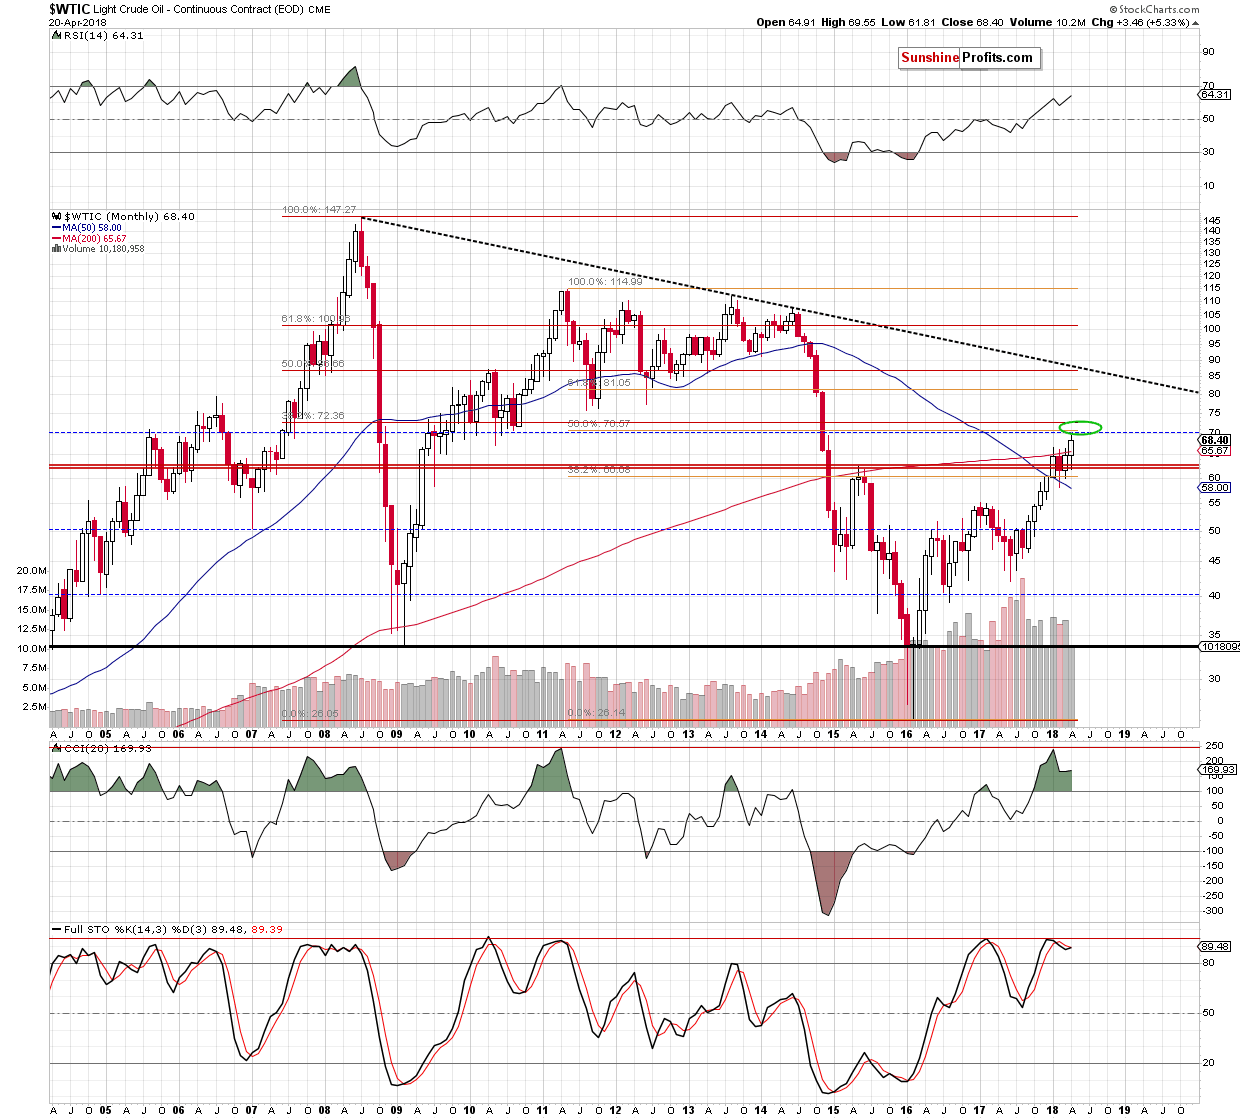
Looking at the monthly chart, we can notice that light crude almost touched the strong resistance area (marked with the green ellipse) created by the barrier of $70, the 50% Fibonacci retracement based on the 2011-2016 downward move and the 38.2% retracement based on the entire 2008-2016 declines. This means that even if oil bulls manage to push crude oil a bit higher once again and create a fresh peak on April 25 or April 26, the space for gains is limited and further deterioration is just around the corner.
On top of that, the pro-bearish scenario is also reinforced by the current picture of the WTIC:UDN ratio about which we wrote in our Wednesday’s Oil Trading Alert:
Crude Oil from Non-USD Perspective
(…) As a reminder, please note that UDN is the symbol for the PowerShares DB US Dollar Index Bearish Fund, which moves in the exact opposite direction to the USD Index. Since the USD Index is a weighted average of the dollar's exchange rates with world's most important currencies, the WTIC:UDN ratio displays the value of crude oil priced in "other currencies".
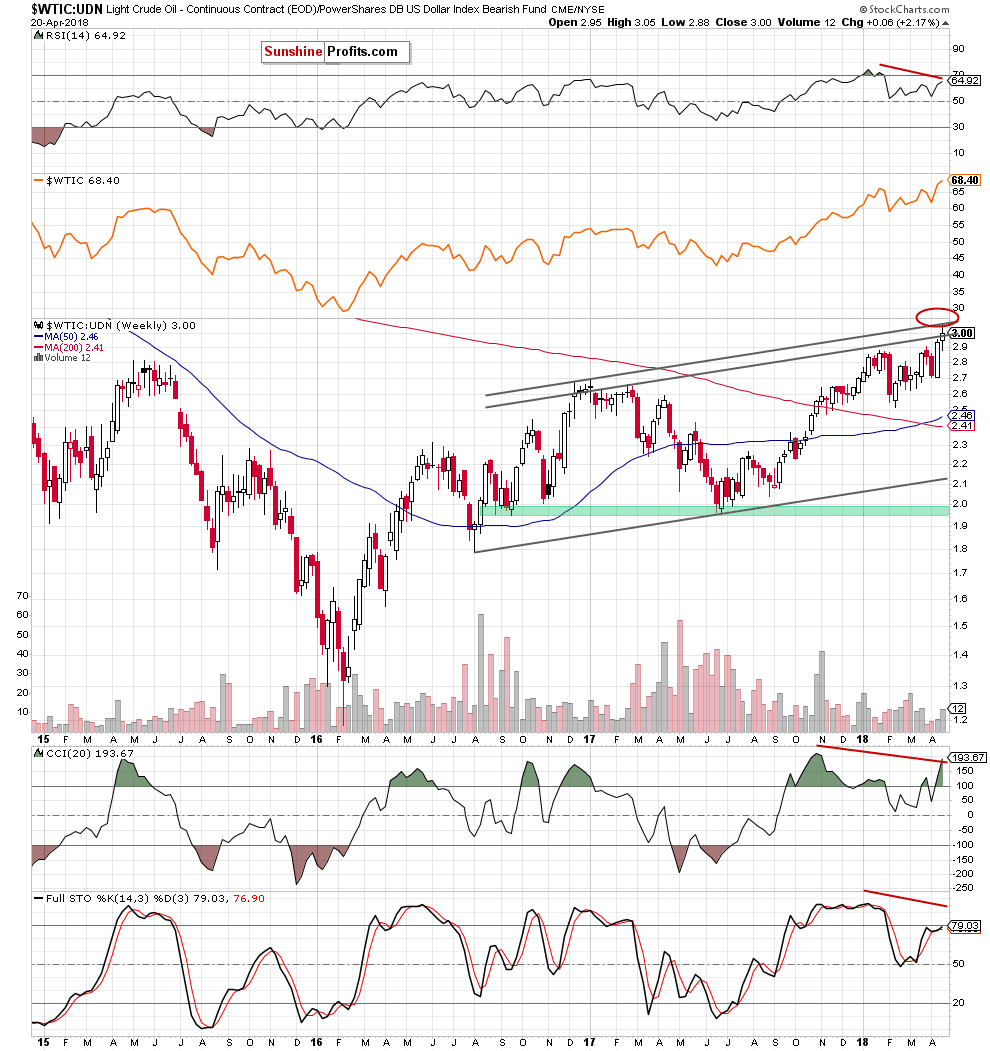
(…) the ratio extended gains and climbed to the strong resistance area created by the upper borders of the black rising trend channel (based on an intraweek highs and closing prices), which suggests that the space for gains may be limited and reversal is just around the corner.
Additionally, these are clearly visible negative divergences between the ratio and the indicators, which increases the probability of a downswing in a very near future.
Summing up, Friday’s session brought an upswing, which looks like a verification of the earlier breakdown under the upper border of the green rising trend channel. Therefore, we continue to think that as long as there is no confirmed breakout above the upper line of the formation another attempt to move lower is likely – especially when we factor in the triangle apex reversal pattern (seen on the daily chart), the proximity to strong resistance zone (marked on the monthly char) and the current situation in the non-USD chart of crude oil.
Nevertheless, taking all the above into account (especially, the probability of one more attempt to move higher tomorrow or on Wednesday - based on the 2018 crude oil’s turning points), we decided to move the stop-loss order higher to avoid closing our short positions caused by one-day upswing (e.g. after the publication of the API or EIA weekly reports on crude oil and its products inventories).
Trading position (short-term; our opinion): Short positions (with a stop-loss order at $70.96 and the initial downside target at $62.85) are justified from the risk/reward perspective. We will keep you informed should anything change, or should we see a confirmation/invalidation of the above.
On an administrative note, due to your Editor’s travel plans for the rest of the week, the next few alerts will be shorter than the ones that we’ve been publishing recently. Of course, we will keep an eye on the market and we’ll keep posting the alerts on a daily basis, plus intraday alerts whenever the situation requires it.
Thank you.
Nadia Simmons
Forex & Oil Trading Strategist
Przemyslaw Radomski, CFA
Founder, Editor-in-chief, Gold & Silver Fund Manager
Gold & Silver Trading Alerts
Forex Trading Alerts
Oil Investment Updates
Oil Trading Alerts

