

Trading position (short-term; our opinion): No positions are justified from the risk/reward perspective.
Although crude oil increased above several nearest resistances earlier this week, yesterday’s session showed that oil bulls are still weak enough to defend gained levels. This manifestation of weakness caused a test of the support zone based on the barrier of $ 50 and two Fibonacci retracements. Will these levels be strong enough to withstand the selling pressure in the coming week?
Let’s analyze the charts below to find out what the coming days can bring (charts courtesy of http://stockcharts.com).
On Tuesday, we wrote the following:
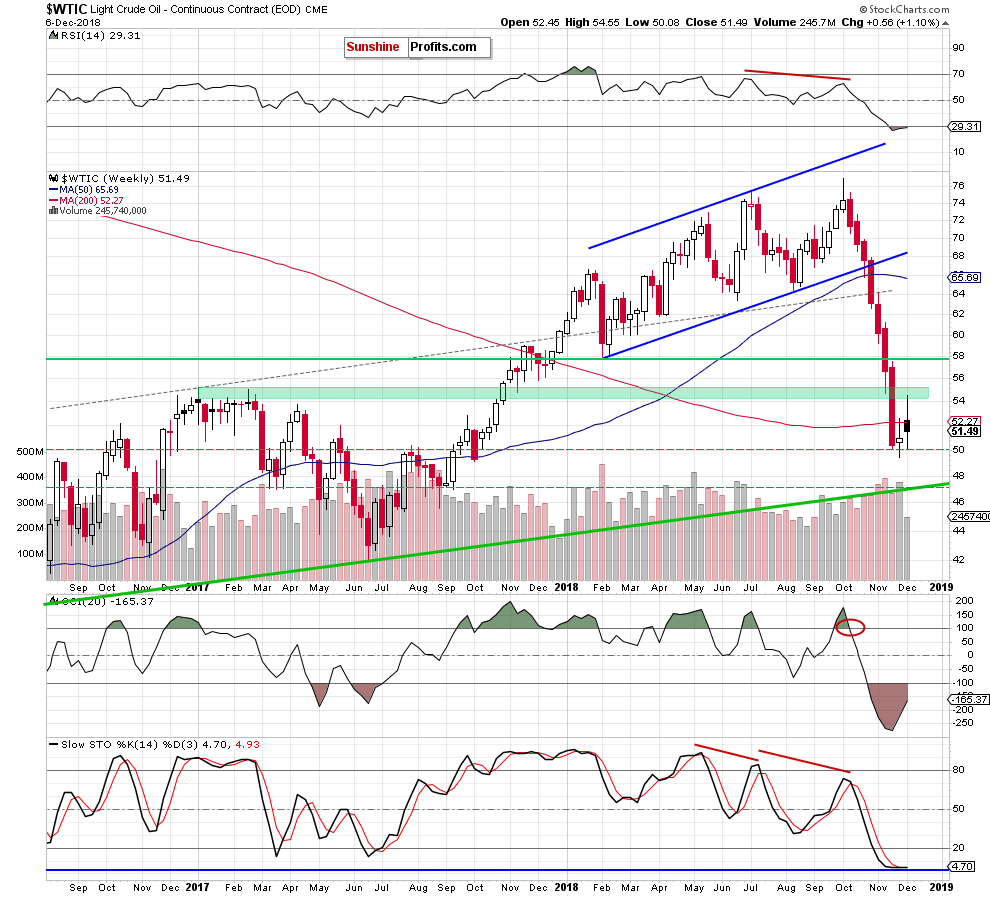
(…) the price of black gold moved above the last week’s major resistance – the 200-week moving average and closed the day above it. Although this may look encouraging (especially when we add the buy signal generated by the Stochastic Oscillators), please keep in mind that the week has just begun and therefore, in our opinion, until we see the end of the week above that resistance, it cannot be considered as a bull's ally.
Looking at the weekly chart, we see that the foresight was rewarded because the price of crude oil reversed and declined after our comments were posted. Thanks to yesterday’s downswing (about which we’ll write more analyzing the daily chart) black gold slipped under the previously-broken 200-week moving average, invalidating the earlier small breakout. Such price action doesn’t look encouraging (suggesting further deterioration), however as we wrote above, we continue to believe that waiting for today's closure is justified before we make any investment decisions.
How did this price action affect the short-term picture of the commodity?
Let’s zoom the above chart to see all needed details more clearly.
Before we answer to the above question, let’s recall the quotes from our yesterday’s Oil Trading Alert:
Yesterday there was no trade in US, which is why today's alert will analyze Wednesday's crude oil futures’ performance. What interesting can yesterday's price action tell us about the next move of black gold?
(…) the green gap encouraged oil bulls to act but their yesterday's determination raises quite big concerns about their potential strength (…).
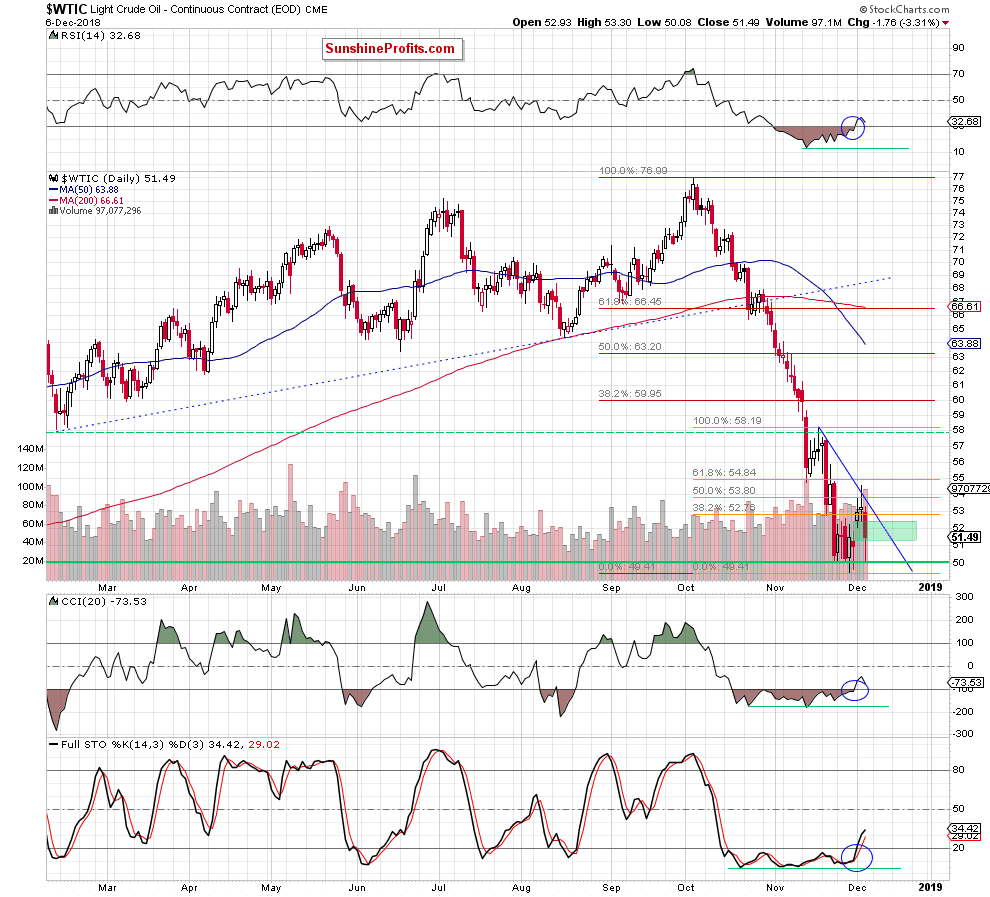
Why? (…) although they broke not only above the blue resistance line based on the previous highs but also above the red resistance line (based on four earlier peaks created on the October 10, October 17, October 29 and October 31), they didn’t manage to hold gained levels for the second time in a row.
As a result, the price declined once again, invalidating the earlier breakouts (not only above these lines but also above the 50% Fibonacci retracement), which doesn’t confirm that the bulls have strengthened enough to be able to generate a bigger move to the north. Additionally, the Stochastic Oscillator generated a sell signal earlier today, increasing a probability of another downswing in the very near future.
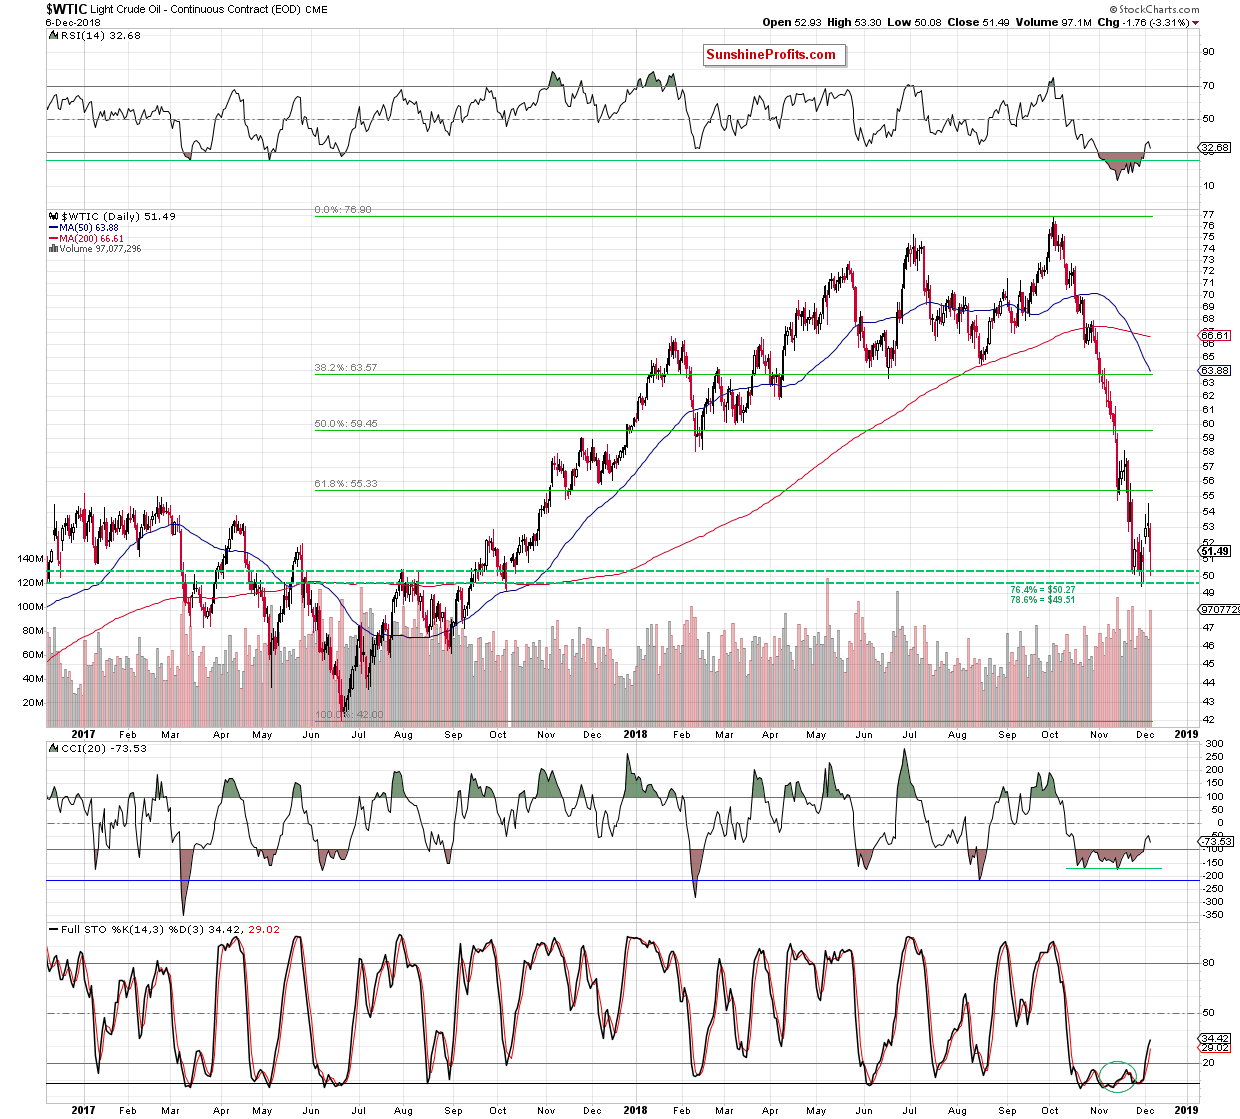
(…) looking at the shape of the entire October-November downward move, we think it's more likely that black gold will re-test the recent supports (the barrier of $50 and the support area created by the 76.4% and the 78.6% Fibonacci retracements marked with the green horizontal dashed lines on the daily chart in our Monday’s Oil Trading Alert) or even hit a fresh low around $47.30 (in this area you will find the long-term green support line based on the August 2016 and the June 2017 lows, which is seen more clearly on the daily chart in the above-mentioned alert) before we see a return to higher levels.
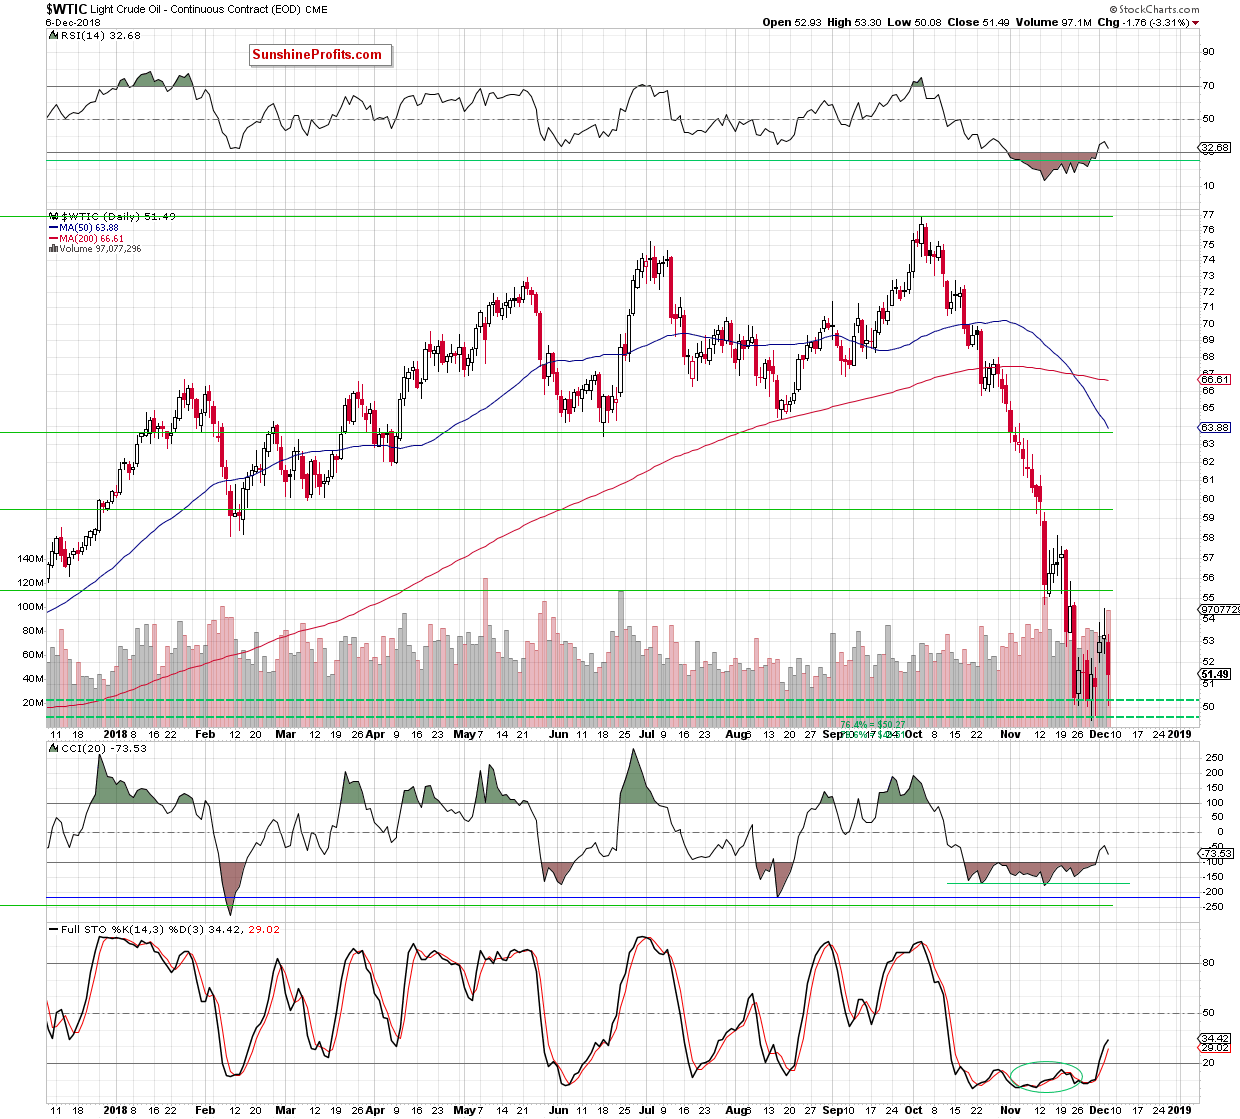
From today’s point of view, we see that the situation developed in tune with our assumptions and crude oil declined during yesterday’s session. Thanks to the sellers’ determination, the price of black gold tested the support area created by the 76.4% and the 78.6% Fibonacci retracements and almost touched the barrier of $50.
Although light crude bounced off these supports before the session closure, the shape of yesterday’s candlestick, the price at which the commodity finished the day (only 22 cents above the lower border of the green gap), the Thursday’s volume and yesterday’s comment on the shape of the entire October-November downward move suggest that the worst for oil bulls can still come – especially if market participants won’t see any decision on cutting oil supply.
At this point, it worth keeping in mind that crude oil output from the world's biggest producers (OPEC, Russia and US) has increased by 3.3 million barrels per day since the end of 2017 (mostly due to the United States, which exported more black gold and fuel than imported for the first time in its record, according to yesterday’s the EIA data).
Connecting the dots, we believe that our pro-bearish scenario from yesterday’s alert remains in the cards, suggesting another attempt to move lower in the following days. We will keep you informed should anything change, or should we see a confirmation/invalidation of the above.
Thank you.
Nadia Simmons
Forex & Oil Trading Strategist
Przemyslaw Radomski, CFA
Founder, Editor-in-chief, Gold & Silver Fund Manager
Gold & Silver Trading Alerts
Forex Trading Alerts
Oil Investment Updates
Oil Trading Alerts

