

Trading position (short-term; our opinion): Short positions (with a stop-loss order at $54 and the initial downside target at $45.80) are justified from the risk/reward perspective.
On Friday, crude oil moved sharply lower and dropped not only below the barrier of $50, but also under previously-broken levels and lines, invalidating the earlier breakouts. In these circumstances, light crude lost 2.95% and confirmed a bearish top formation. What does it mean for black gold?
Crude Oil’s Technical Picture
Let’s take a closer look at the charts below and check the technical picture of the commodity (charts courtesy of http://stockcharts.com).
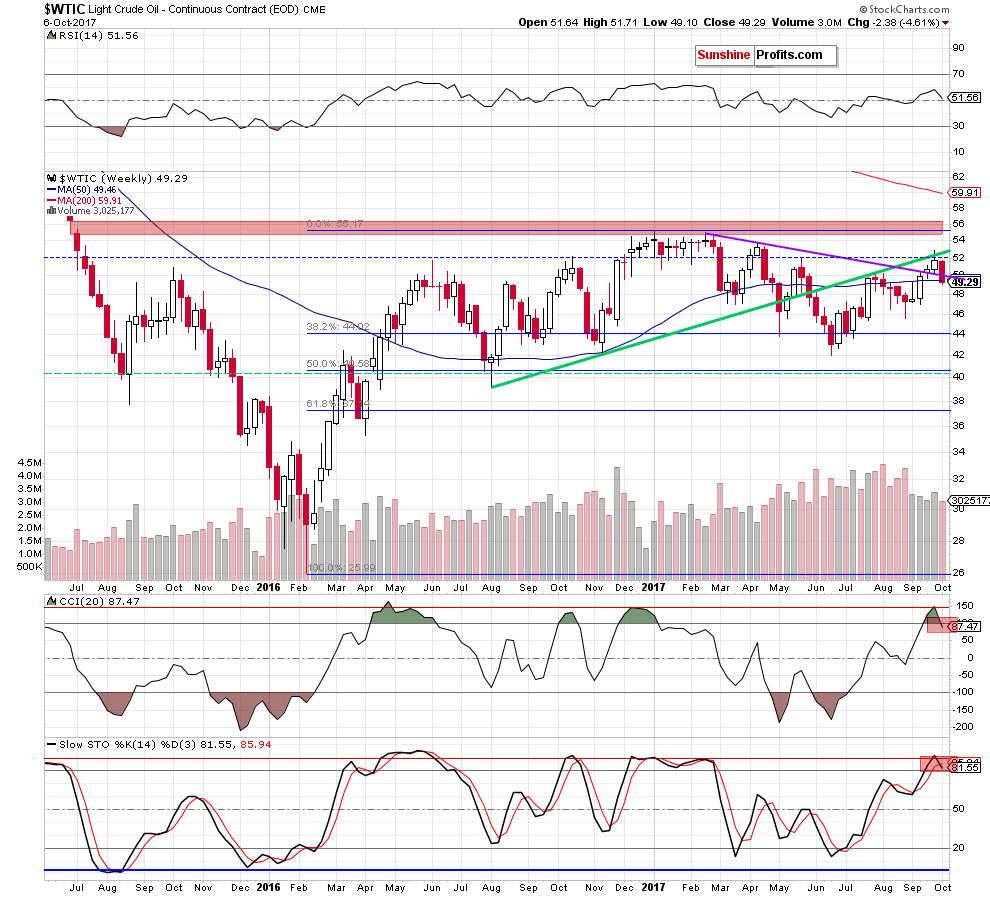
The first thing that catches the eye on the medium-term chart is an invalidation of the earlier breakout above the long-term purple declining line based on the February and April peaks (a bearish event). Additionally, thanks to the last week drop light crude closed Friday session below the 50-week moving average, invalidating earlier breakout, which is another bearish development.
On top of that, the CCI generated the sell signal (while the signal generated by the Stochastic Oscillator remain in cards), which together with the above-mentioned invalidations suggests further deterioration in the coming week.
How did this decline affect the very short-term chart? Let’s examine the daily chart and find out.
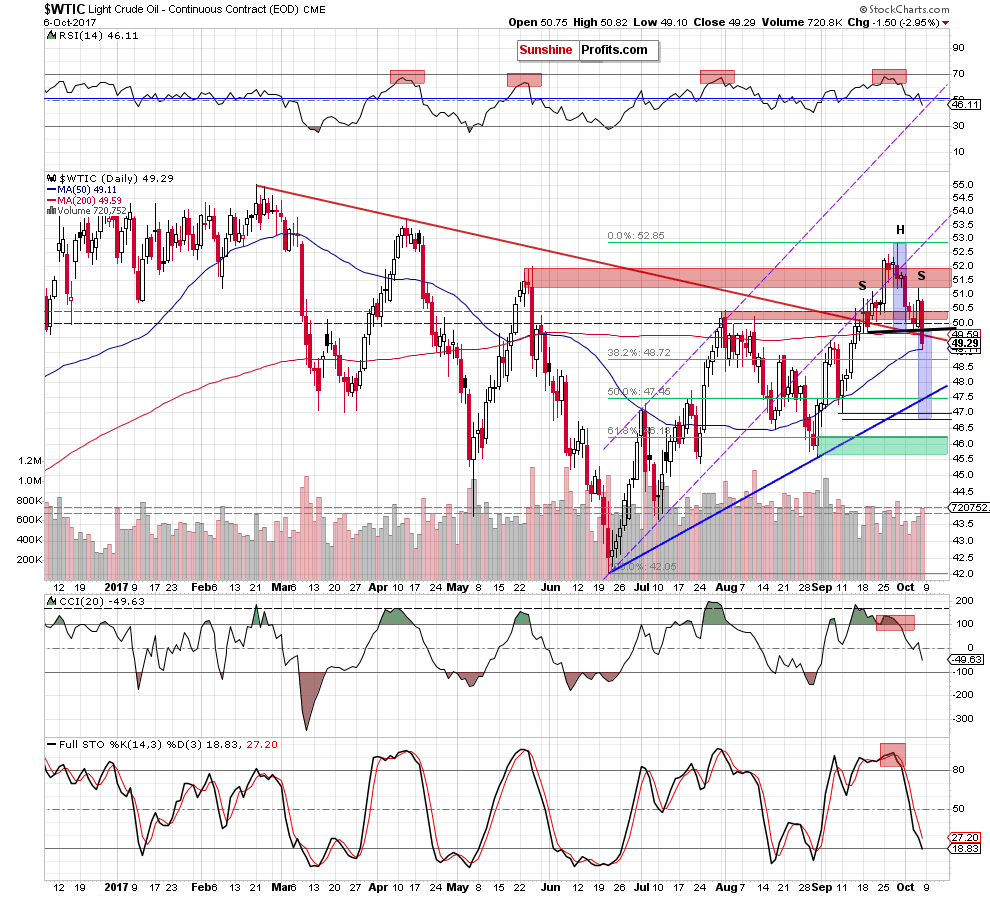
From today’s point of view, we see that although crude oil moved higher on Thursday, the red resistance zone created by the August peaks stopped further improvement, triggering a pullback. On Friday, black gold extended losses, which took the commodity not only below the barrier of $50, but also under the red declining line and the 200-day moving average, which resulted in an invalidation of the earlier breakouts above them.
Bearish formation is underway
On top of that, light crude declined under the black support line based on the recent lows, which confirmed the head and shoulders formation. What does it mean for black gold? In our opinion, the breakdown under the neck line of the pattern (which materialized on visibly higher volume than Thursday increase) suggests that we’ll see a decline to around $46.80-$47, where the size of the downward move will correspond to the height of the formation and where the September 11 low is.
Nevertheless, before we see the price of crude oil at $47, oil bears will have to push the commodity below the 38.2% Fibonacci retracement based on the June-September upward move (around $48.72), the short-term blue support line based on the June and August lows (currently around $47.45) and the 50% Fibonacci retracement.
Will they manage to do that? Taking into account the sell signals generated by the daily and weekly indicators, the size of volume during declines and the above-mentioned invalidations of the earlier breakouts above important lines and levels, we believe that lower prices of crude oil are more likely than not.
The pro bearish scenario is also reinforced by the long-term picture of the commodity.
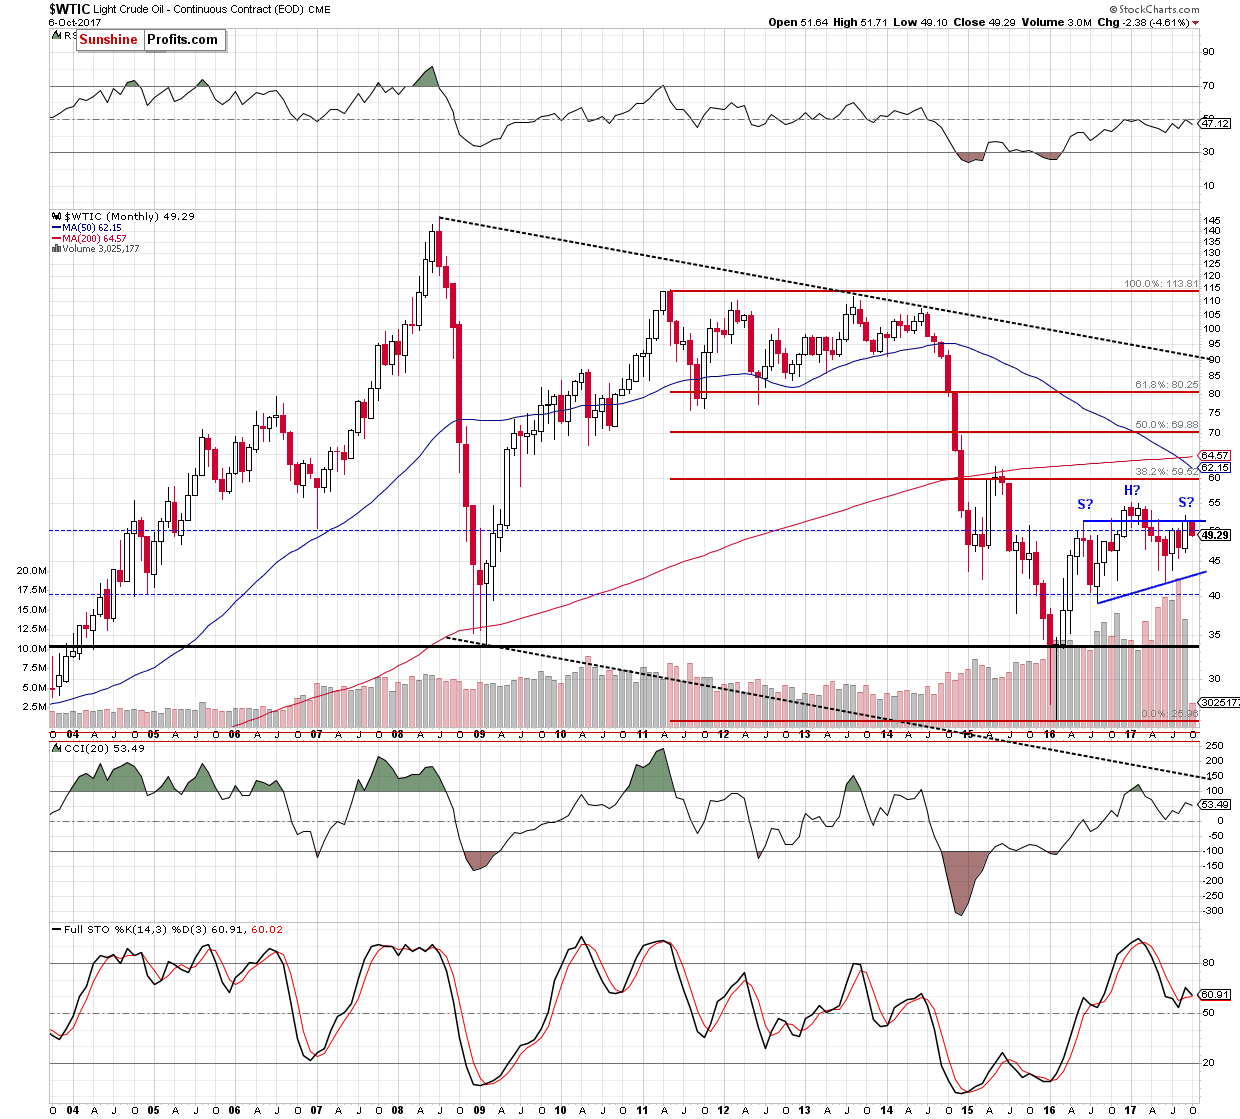
Looking at the monthly chart, we can notice a potential head and shoulders formation. Of course it will be more bearish and reliable only if crude oil falls below the neck line of the pattern (the blue support line based on the August 2016 and June 2017 lows around $43.20 at the moment of writing these words), but we think that oil bears will use all the above-mentioned negative events to create the right shoulder of the pattern in the following weeks.
Summing up, short positions continue to be justified from the risk/reward perspective as crude oil extended losses on higher volume and invalidated the earlier breakout above the barrier of $50, the 200-day moving average and the purple declining line based on the February and April highs. On top of that, oil bears confirmed the head and shoulders formation, closing Friday session under the black support line based on the recent lows, which together with the sell signals generated by the indicators suggest that we’ll see lower prices of crude oil in the coming week.
Very short-term outlook: bearish
Short-term outlook: bearish
MT outlook: mixed with bearish bias
LT outlook: mixed
Trading position (short-term; our opinion): Short positions (with a stop-loss order at $54 and the initial downside target at $45.80) are justified from the risk/reward perspective. We will keep you – our subscribers – informed should anything change.
Thank you.
Nadia Simmons
Forex & Oil Trading Strategist
Przemyslaw Radomski, CFA
Founder, Editor-in-chief, Gold & Silver Fund Manager
Gold & Silver Trading Alerts
Forex Trading Alerts
Oil Investment Updates
Oil Trading Alerts

