

Trading position (short-term; our opinion): Short position with a stop-loss order at $62.24 and the next downside target at $55 is justified from the risk/reward perspective.
The U.S. - China trade dispute has intensified and oil price doesn't like that it seems. The modest upswing of previous two trading days has been erased in a flash, and black gold is trading now not too far from last week's lows. How strong are the bears still? Can we expect the decline's continuation, or are there any tentative signs of oil price recovery just ahead?
Let's take a closer look at the chart below (charts courtesy of http://stockcharts.com).

The weekly chart shows that crude oil retraced a tiny bit of previous week's slide. It still continues to trade below the 50% Fibonacci retracement (marked with red), which suggests that yesterday's upswing could be nothing more than a verification of last week's breakdown below it. The weekly indicators remain in tune with a continuing move lower.
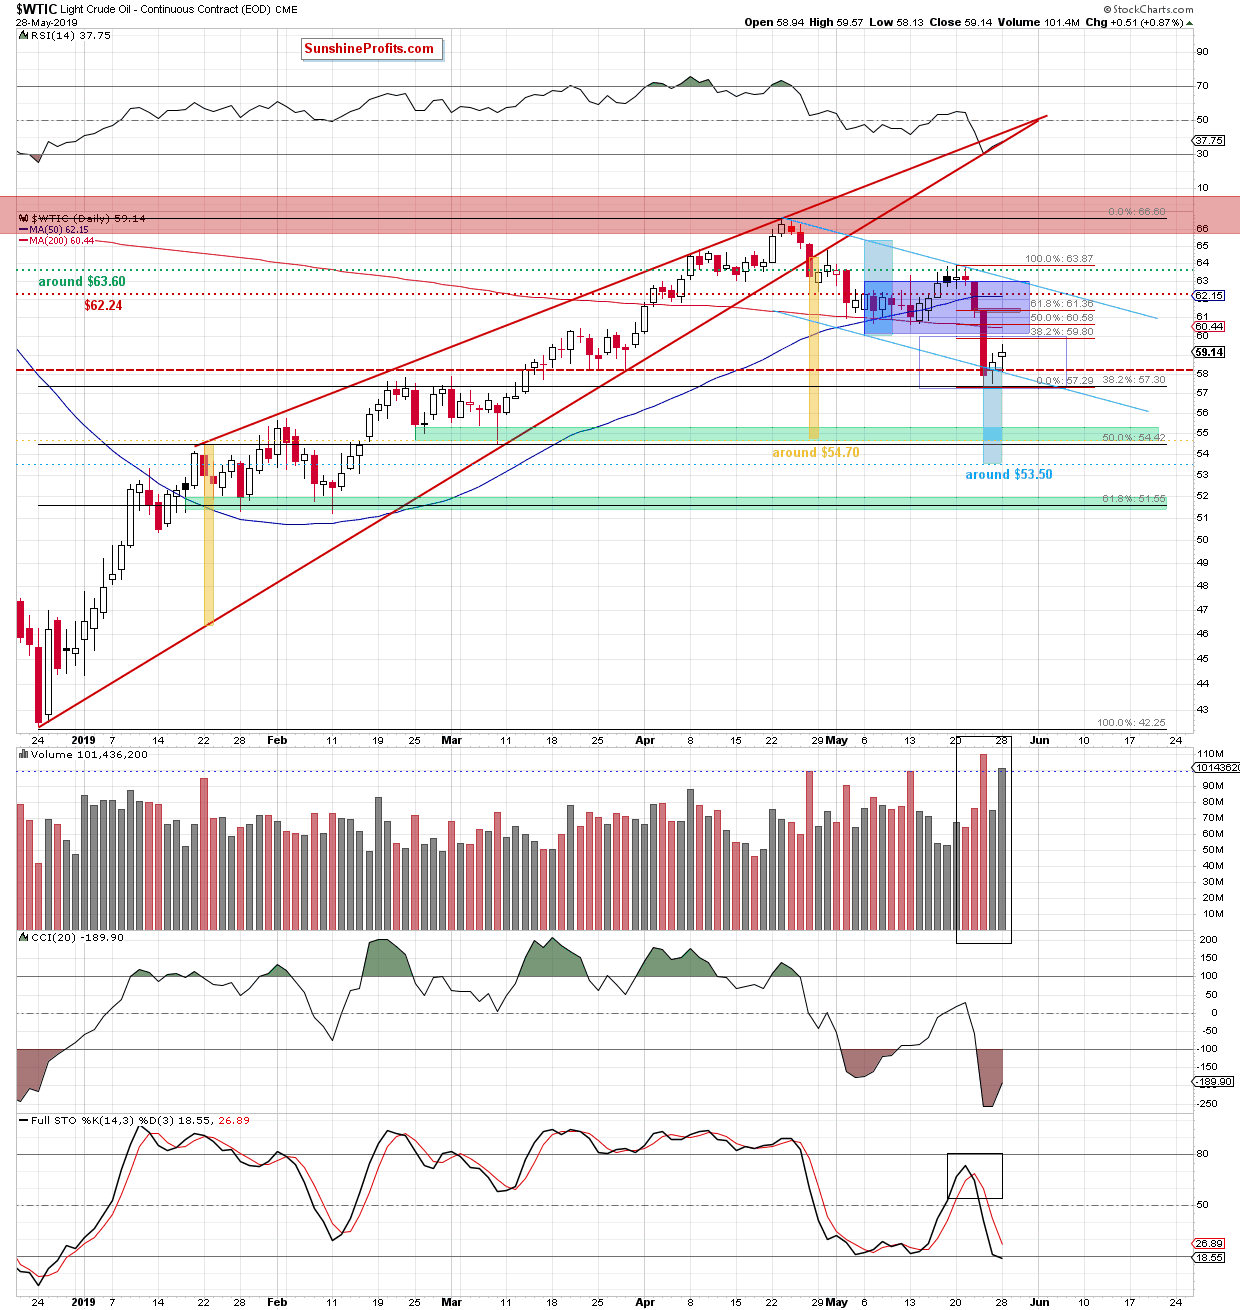
Black gold scored another up day yesterday. It was a weak one though, again. The bulls didn't even reach the 38.2% Fibonacci retracement of last week's decline solely, which increases the likelihood of seeing another downswing in the coming days.
This is especially probable when we look at the weekly picture and the similarity to the gap in November 2018. Let's quote our latest Alert:
(...) Crude oil has created a similar gap in November 2018 - that's not too far from yesterday's gap. Back then, oil bears also created a long red candlestick on very high volume (it's marked with a blue vertical line). There was an attempt to repair the damage in the following days but the bulls' efforts failed after a few days, and light crude declined again.
Will the history repeat itself? It's quite likely. There's also one more thing speaking for the bears today - back then, the Stochastic Oscillator supported the buyers, now it visibly favors the sellers.
How low could the oil price go next? Let's remember our Friday's words:
(...) If the commodity extends losses from here, we could see a drop even to around $53.50, where the size of the decline corresponds to the height of the channel.
But the first target for the sellers will be a bit higher - at around $54.70, where the size of the downward move equals the height of the rising red wedge (as marked with yellow rectangles).
This is the area marked by the 50% Fibonacci retracement, the late-February and early-March lows. They together create the green zone serving as the next important support for the bulls.
Summing up, the outlook for oil remains bearish. Last two days' upswing has ended and the price again powerfully marches lower today. Black gold keeps trading beneath important short-term resistances, and its rebound from the lower border of the declining blue trend channel and the dashed green support line is in jeopardy. The weekly indicators and volume comparison continue to support lower prices and the daily picture concurs. The short position continues to be justified.
Trading position (short-term; our opinion): Profitable short position with a stop-loss order at $62.24 (we moved it under our entry level - marked with the green horizontal dotted line- to protect some of the gains) and the next downside target at $55 is justified from the risk/reward perspective.
Thank you.
Nadia Simmons
Forex & Oil Trading Strategist

