

This month’s Oil Investment Update we begin with the words that we used to summarize the situation in the previous update (on August 8, 2017). We summarized the situation in the following way:
Looking at the short-term picture of crude oil (an invalidation of the breakouts above the 61.8% Fibonacci retracement based on the entire 2017 downward move, the barrier of $50, the previously-broken upper border of the purple rising trend channel and the 200-day moving average) and the current situation in the (…) ratios, it seems to us that crude oil will extend losses in the coming weeks. This scenario is also reinforced by the sell signals generated by the daily indicators and declining size of volume, which has accompanied recent increases (in the case of crude oil and our ratios). Therefore, we think that if the black gold slips below the lower border of the blue consolidation, we’ll see a complete or at least partial realization of our bearish scenario in the coming weeks:
(…) we’ll likely see a test of the lower border of the purple rising trend channel and the 50% Fibonacci retracement (around $46.30) or even a drop to the 61.8% retracement and the July 24 low of $45.40.
From today’s point of view, we see that oil bears pushed crude oil lower as we had expected, which resulted in a drop to the August low of $45.58. Despite this deterioration, at the turn of August and September light crude rebounded sharply and came back to the levels, which we saw at the beginning of the previous month. Where will the commodity head in September? Let’s jump right into the charts (charts courtesy of http://stockcharts.com) and try to find out what can we expect in the coming weeks.
Crude Oil
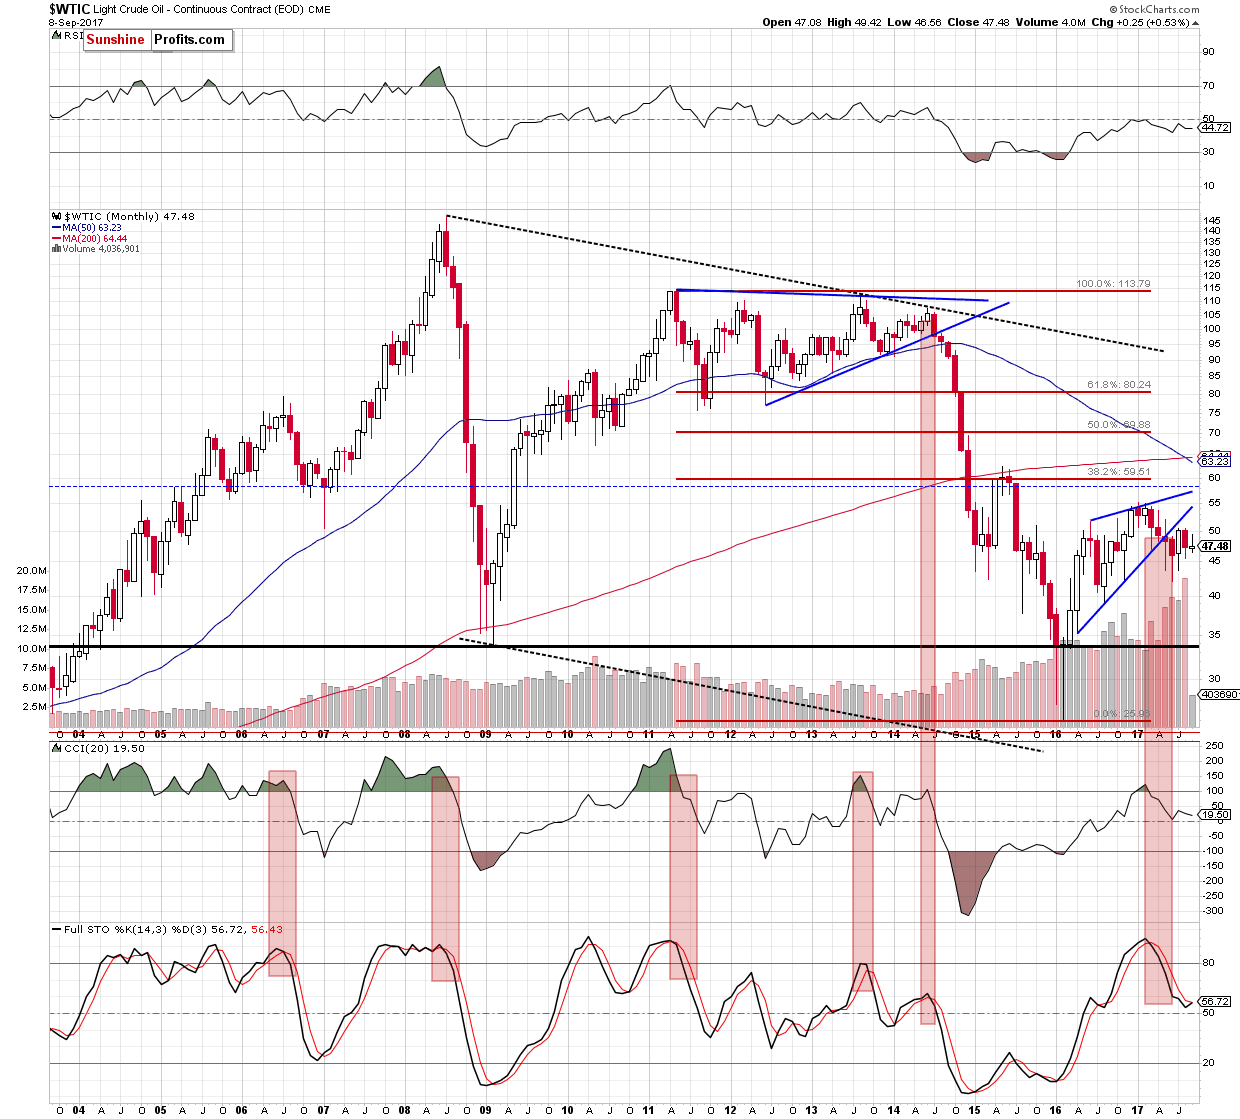
From the long-term perspective we see that the black gold lost almost 6% in August and closed another month under the lower border of the blue rising wedge. What’s interesting the last month’s decline materialized on huge volume (we haven’t seen such huge value since more than 10-years), which suggests that oil bears are not weak as it could seem and further deterioration (and significant move to the downside) is still ahead of us - especially when we factor in the sell signals generated by the long-term indicators.
Will the medium-term chart give us more bearish factors? Let’s examine the chart below to find out.
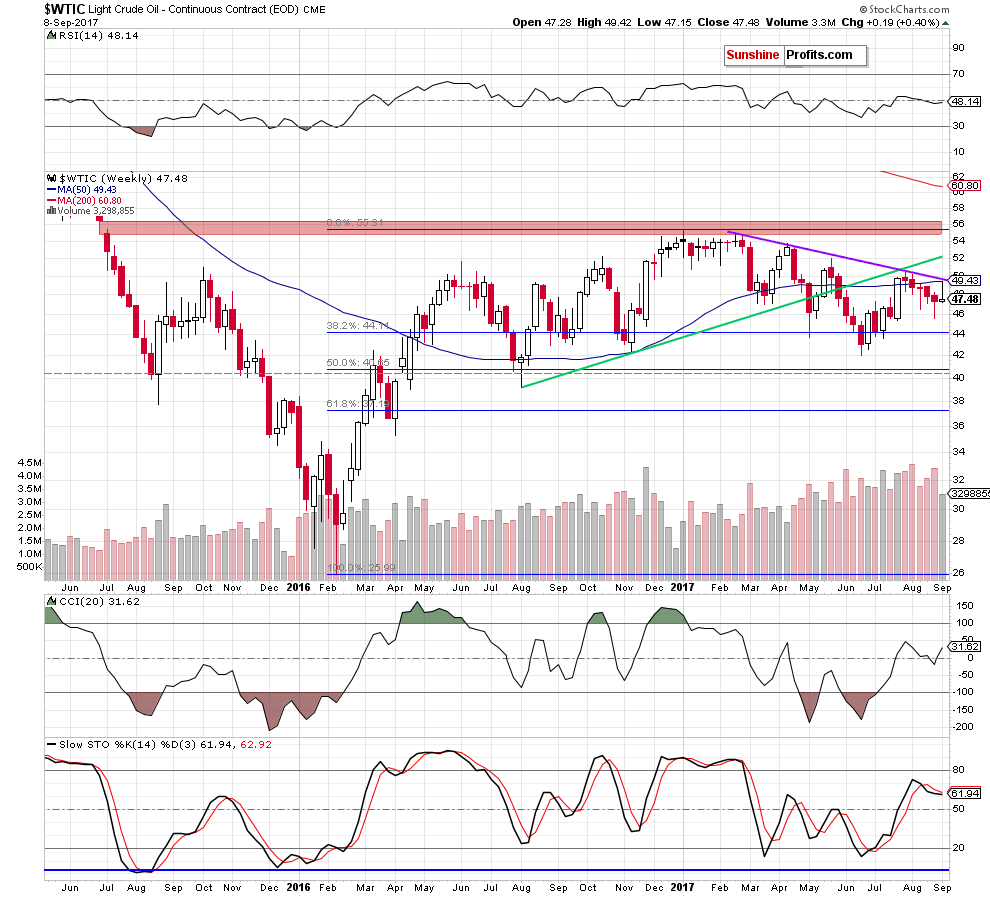
On the weekly chart, we see that although crude oil extended gains in the previous week, this increase didn’t change anything. Why? As you see on the above chart, the combination of the long-term purple declining resistance line based on the February and April highs and the 50-week moving average stopped oil bulls once again, triggering a pullback– similarly to what we saw in the previous months.
Thanks to this drop light crude created a bearish candle on the weekly chart (visibly longer upper shadow suggests a turning point), which verified the earlier breakdown below the long-term purple declining resistance line and the 50-week moving average once again. Taking this bearish development into account and combining it with the sell signal generated by the weekly Stochastic Oscillator, we think that further deterioration is more likely than not.
Will the very short-term chart confirm this scenario? Let’s check.
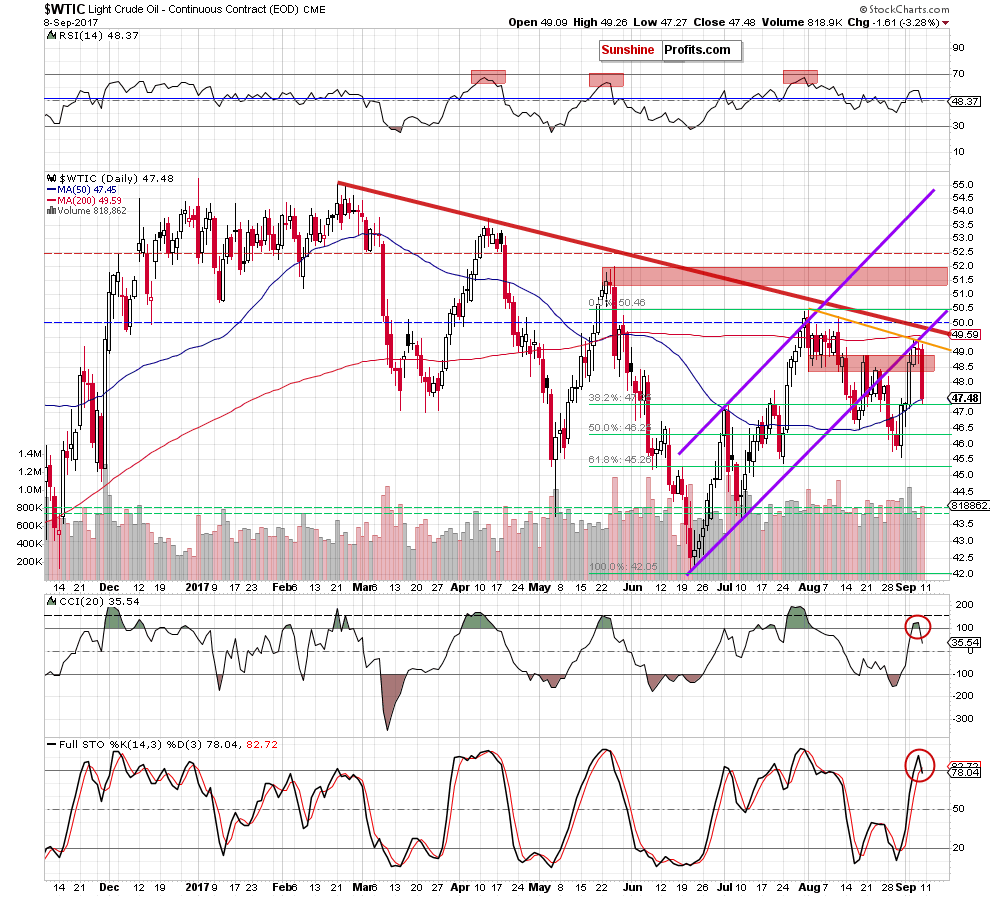
When we take a closer look at the daily chart, we can easily notice more bearish factors. As you see on the above chart, crude oil reversed and declined after an increase to the lower border of the purple rising trend channel, which resulted in another verification of the earlier breakdown under this short-term resistance. Additionally, the commodity invalidated the earlier breakout above the red resistance zone and closed the day below it. On top of that, CCI and the Stochastic Oscillator generated the sell signals, supporting oil bears and further deterioration.
How low could the commodity go in the coming days/weeks? Before we know the answer to this question, let’s examine the current situation in our interesting ratios. What can we infer from them?
Ratio Analysis
Let’s start this section with the long-term chart of the oil-to-oil stocks chart.
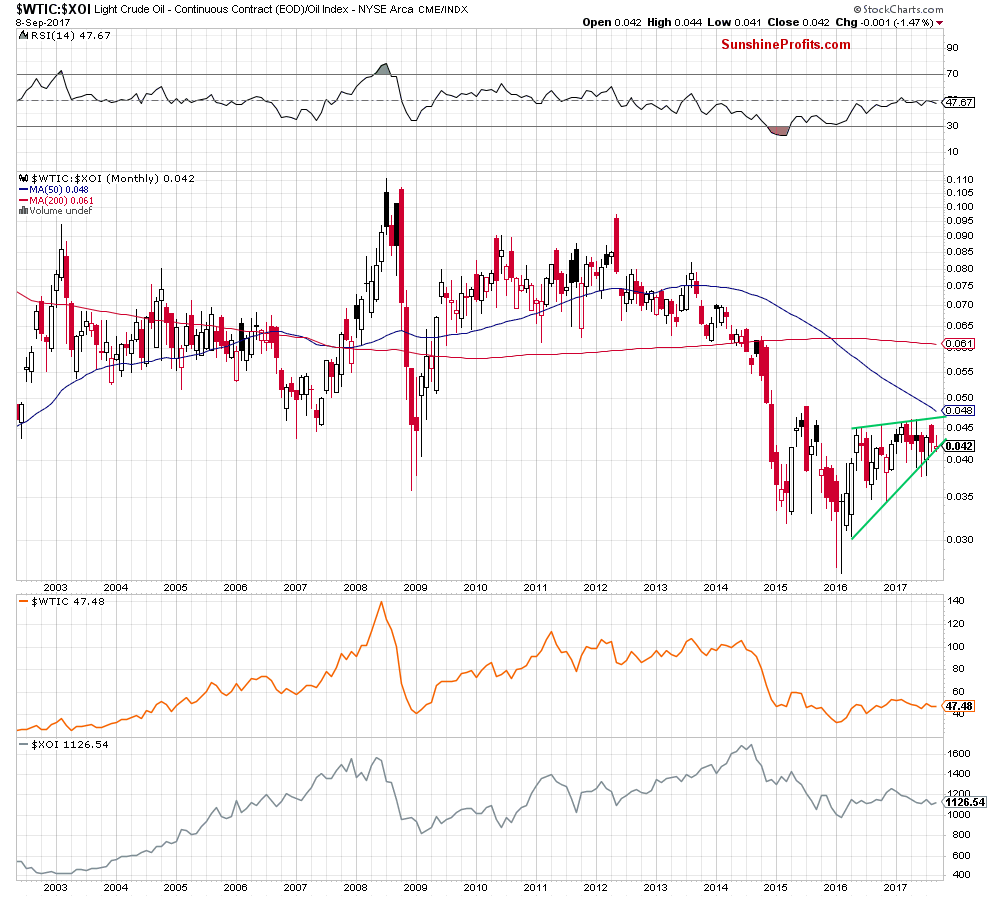
Looking at the monthly chart, we see that the lower border of the green wedge stopped further declines, triggering a rebound at the beginning of September. Despite this improvement, bulls didn’t manage to hold gained levels, which resulted in a correction of earlier upswing. In this way, the ratio erased most of the earlier gains, which doesn’t bode well for further improvement.
What can we infer about future moves from the weekly chart? Let’s check.
From this perspective, we see that recent increases took the ratio to the long-term key resistance red zone, which stopped bulls many times in the previous months. As you see on the above chart, history repeated itself once again and the ratio pulled back in the previous week, which resulted in a bearish candle – similar to what we saw on the medium-term chart of crude oil. Additionally, the CCI reversed and declined, while the Stochastic Oscillator generated the sell signal, which suggests that we’ll see lower values of the ratio in the coming weeks – especially if we see a breakdown under the green support line marked on the above chart. In this case, we’ll likely see not only a test of the May and Jun lows, but also a decline to the November or even August 2016 lows.
What does it mean for light crude? On the above charts, we see that the positive correlation between the ratio and the black gold remain in place, suggesting that declines in the ratio will also have a negative impact on the price of the commodity.
Having said the above, let’s focus on the relation between crude oil and gold.
A month ago, we wrote the following:
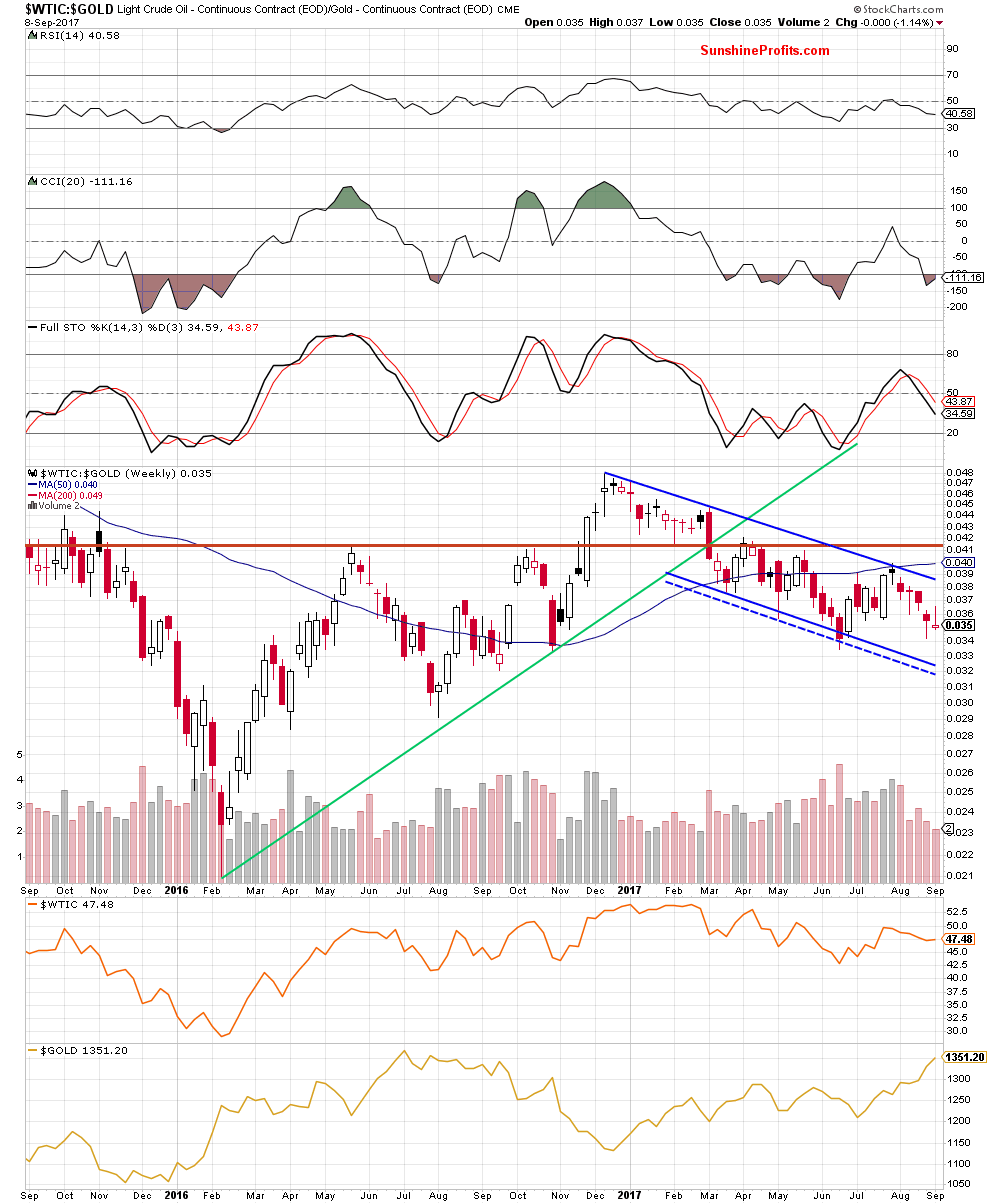
(…) will we see a test of the recent lows in the coming weeks? (…) From today’s point of view, we see that (…) the ratio closed the whole week under the upper border of the blue declining trend channel and the 50-week moving average, invalidating the earlier tiny breakout. Such price action is a negative development, which suggests that further deterioration may be just around the corner.
Looking at the above chart, we see that the situation developed in line with our scenario and the oil-to-gold ratio declined in August. Although we saw a small rebound in the previous week, the long upper shadow of the candlestick suggests that the downward move is not over yet and test of the lower border of the blue declining trend channel should not surprise us in the coming weeks.
Will the very short-term chart confirm this assumption? Let’s take a closer look at the very short-term chart below.
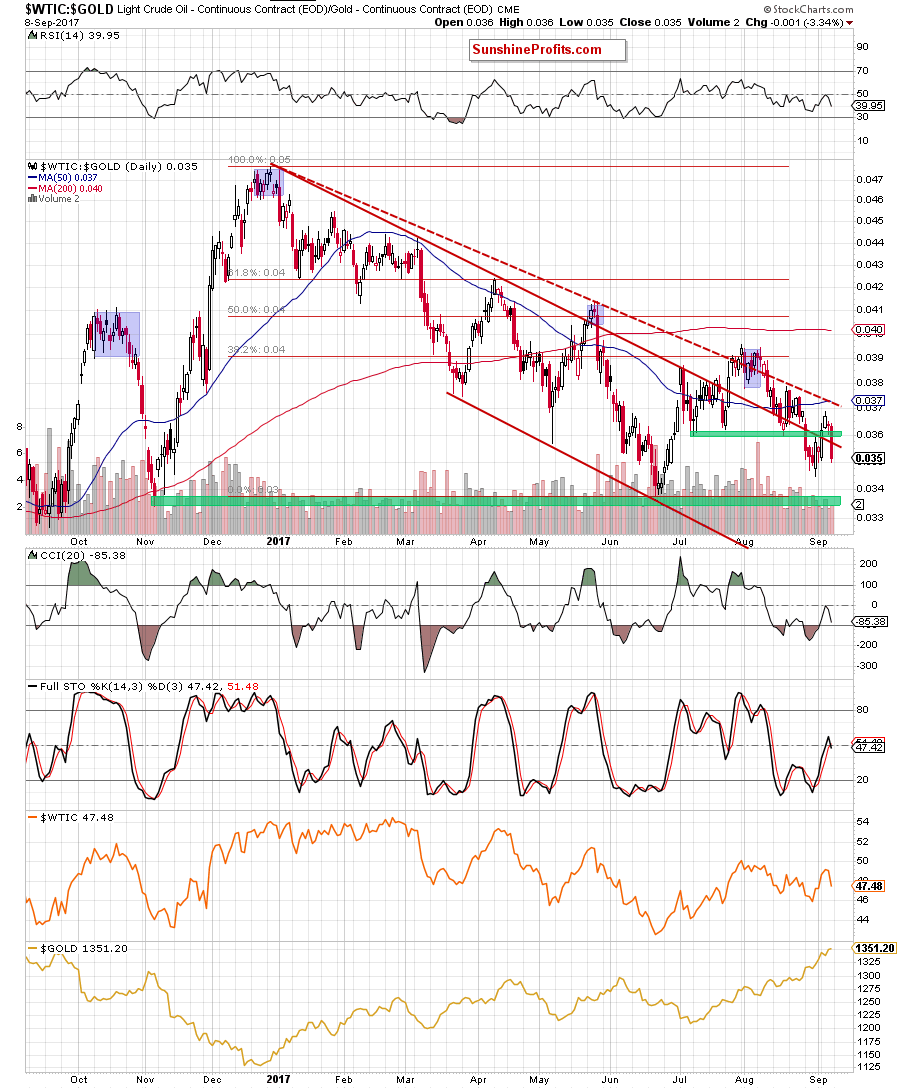
From this perspective, we see that although the ratio invalidated the breakdown under the red declining resistance in the previous week, oil bulls weren’t strong enough to push it to the red dashed declining line and the 50-day moving average. This show of weakness triggered a reversal and decline, which resulted in a comeback below the green support zone and the red line (a bearish development). Additionally, the Stochastic Oscillator generated the sell signal, increasing the probability of further deterioration in the coming days/weeks.
How such price action could affect the price of crude oil? Taking into account the fact that positive correlation between the ratio and the commodity is still in cards, we believe that declines in the ratio will likely translate into lower prices of crude oil.
Finishing today’s commentary on the oil-to-gold ratio, let’s check the monthly chart.
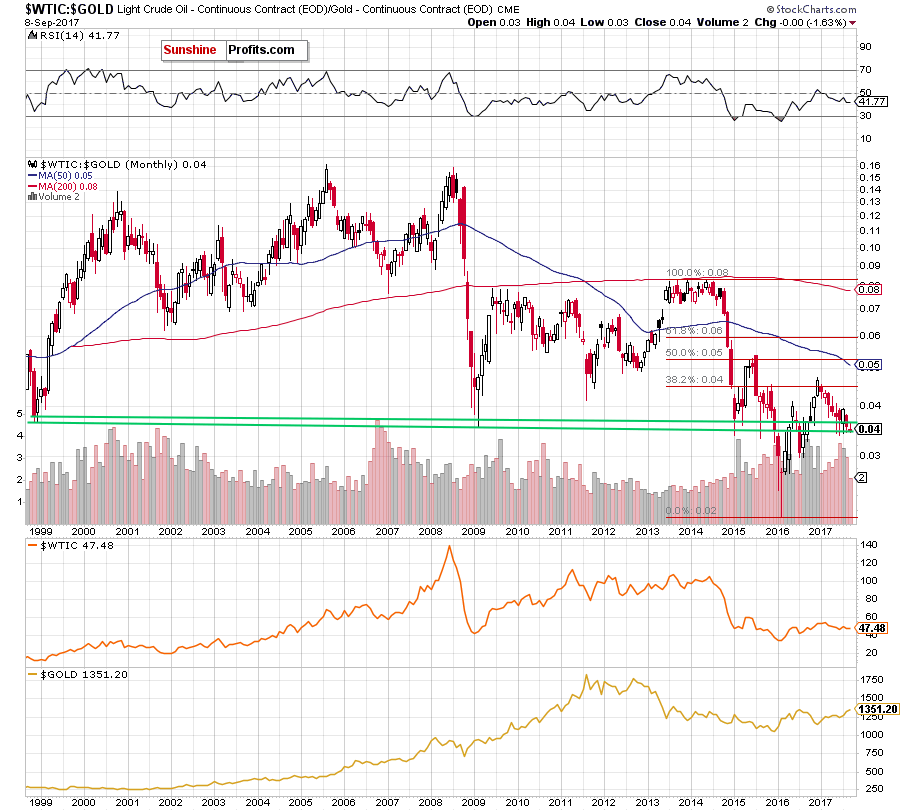
From the long-term perspective, we see that the overall situation hasn’t changed much as the ratio is trading in a narrow range between the May high and low, slightly above the long-term green support lines, which stopped the bears three times in the previous months. Such situation suggests that another sizable move to the downside will be more likely and reliable if we see a monthly closure below this support zone.
Finishing this section let’s focus on the non-USD (WTIC:UDN ratio) chart of crude oil. As a reminder, UDN is the symbol for the PowerShares DB US Dollar Index Bearish Fund, which moves in the exact opposite direction to the USD Index. Since the USD Index is a weighted average of the dollar's exchange rates with world's most important currencies, the WTIC:UDN ratio displays the value of crude oil priced in "other currencies".
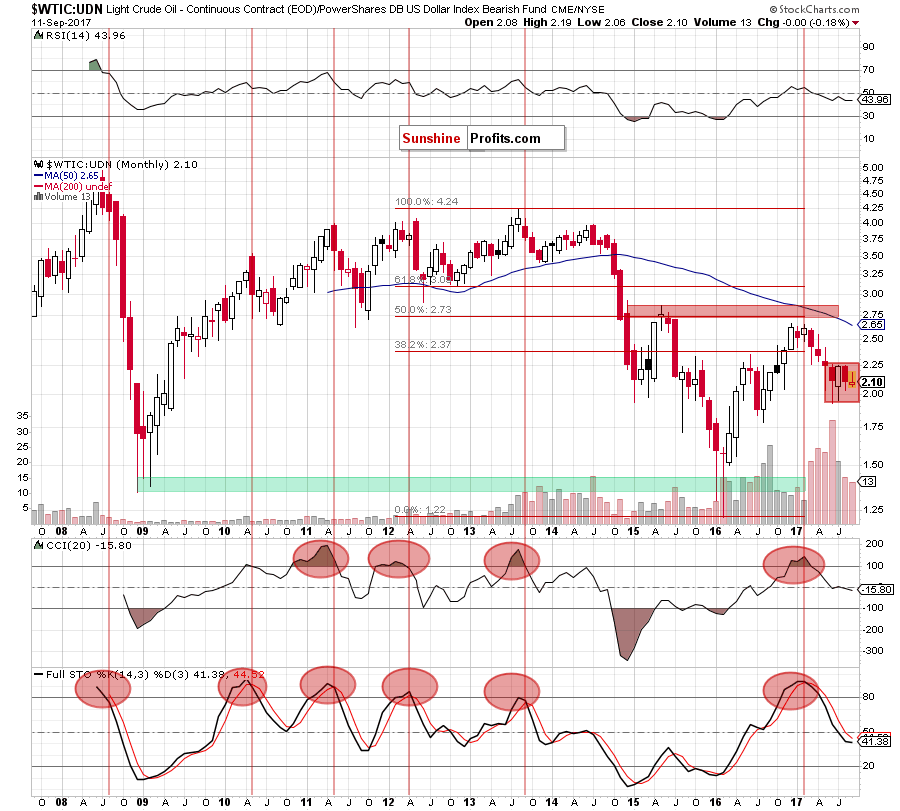
Looking at the long-term chart, we see that the overall situation hasn’t changed much as the ratio is still trading in the red consolidation. Nevertheless, the sell signals generated by the monthly indicators remain in play, suggesting that at least a test of the lower border of the formation is very likely – especially when we factor in the situation on the very short-term chart below.
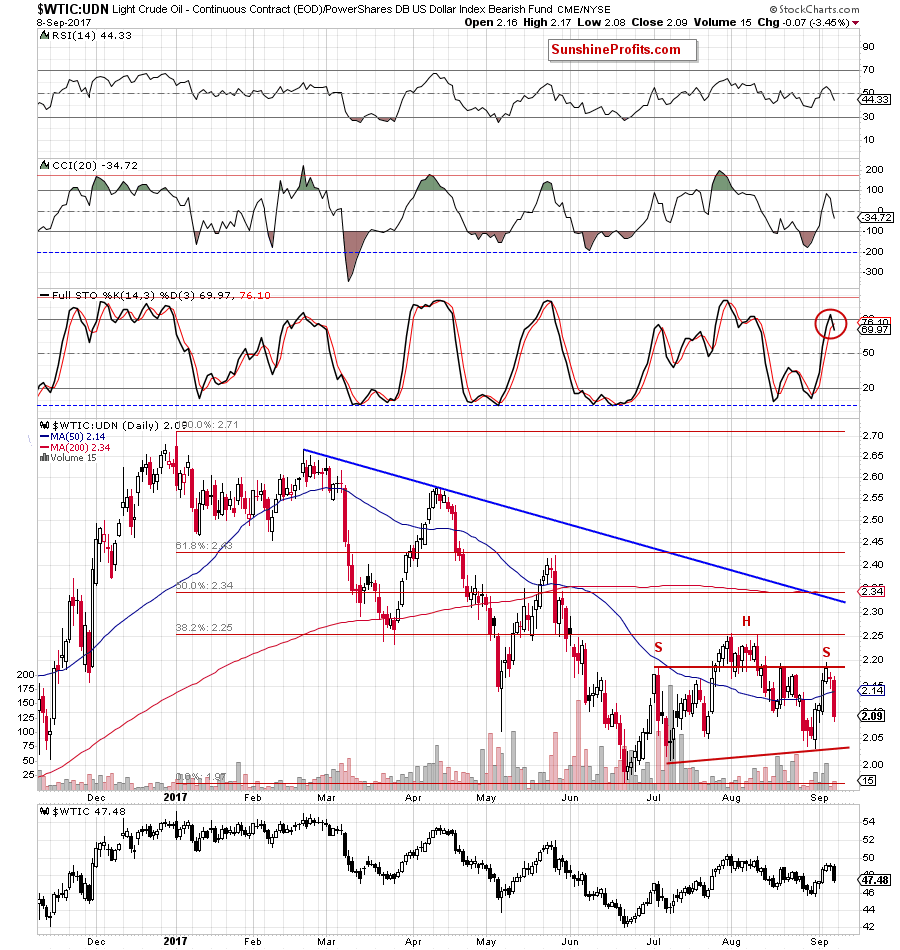
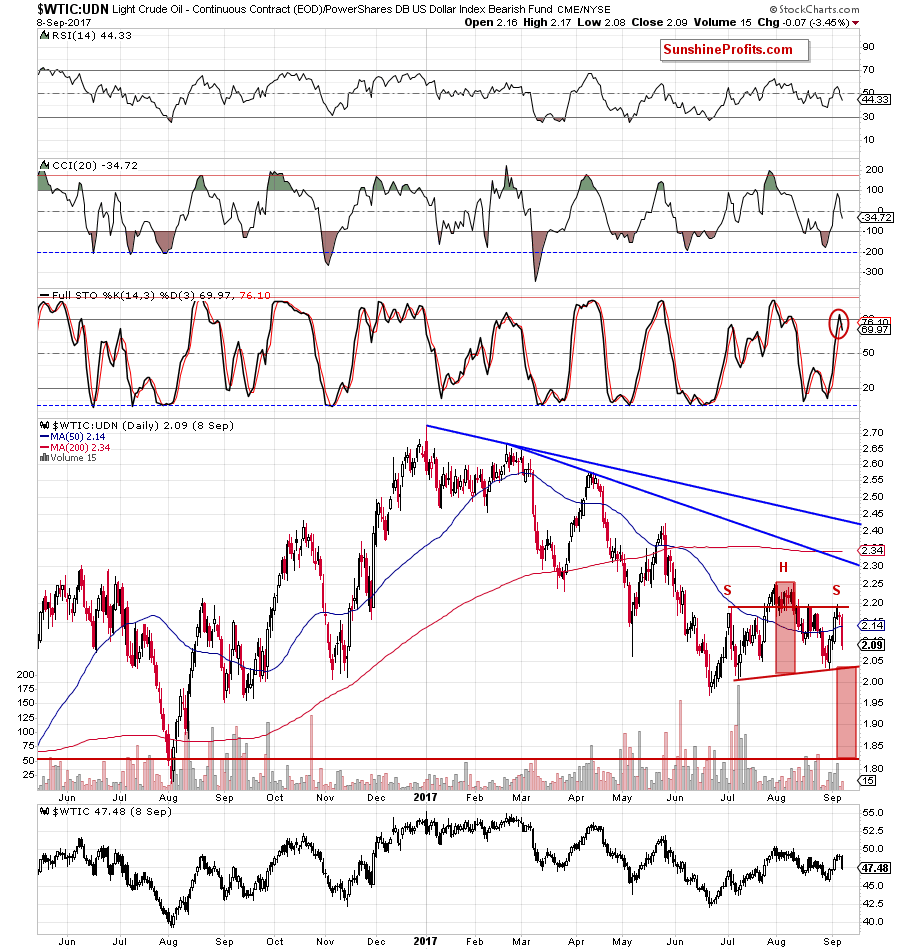
As you see on the daily chart, the recent price action created a potential head and shoulders pattern (the right shoulder is underway), which suggests that we’ll see at least a test of the neck line of the formation (the red support line based on the July and August lows) in the coming week.
What could happen if this important support is broken? In our opinion, such bearish development will open the way not only to the Jun lows, but also to around 1.82, where the size of the downward move will correspond to the height of the formation.
How such drop could affect crude oil priced in U.S. dollars? Without a doubt a confirmation of the above-mentioned head and shoulders formation will give oil bears a very important reason to act, which will likely accelerate declines and trigger not only a test of the 2017 lows, but also a drop to around $40.65, where the 50% Fibonacci retracement (based on the entire 2016-2017 upward move) is (this level is more clearly seen on the medium-term chart of crude oil).
Finishing this month’s Oil Investment Update let’s examine the NYSE Arca Oil Index (XOI) to find out what the current outlook for oil stocks is.
Oil Stocks
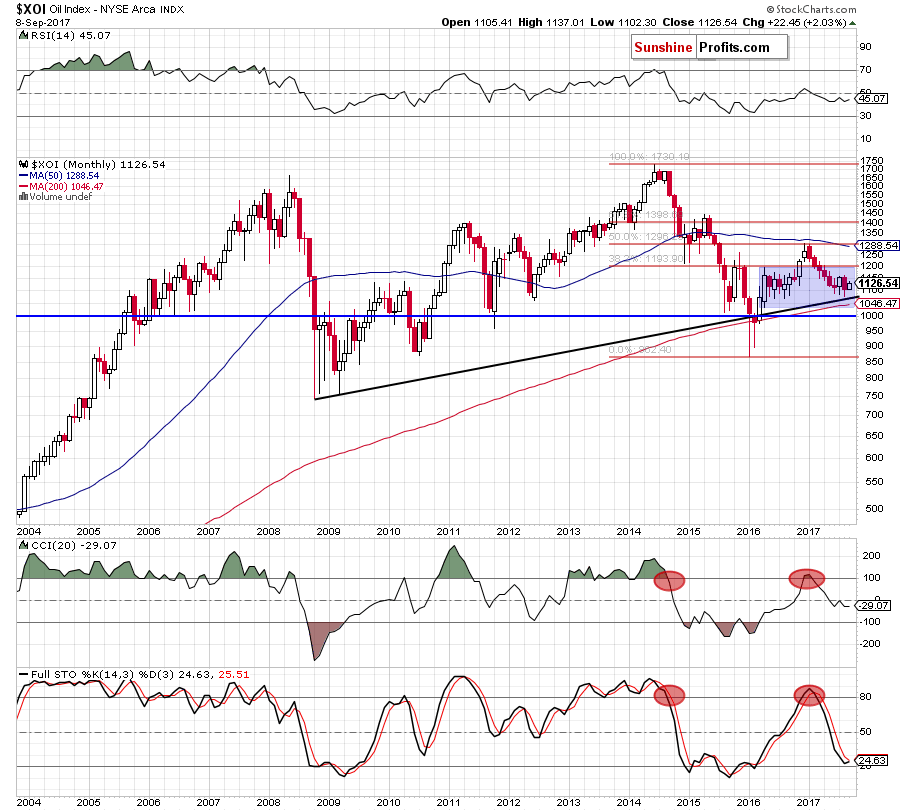
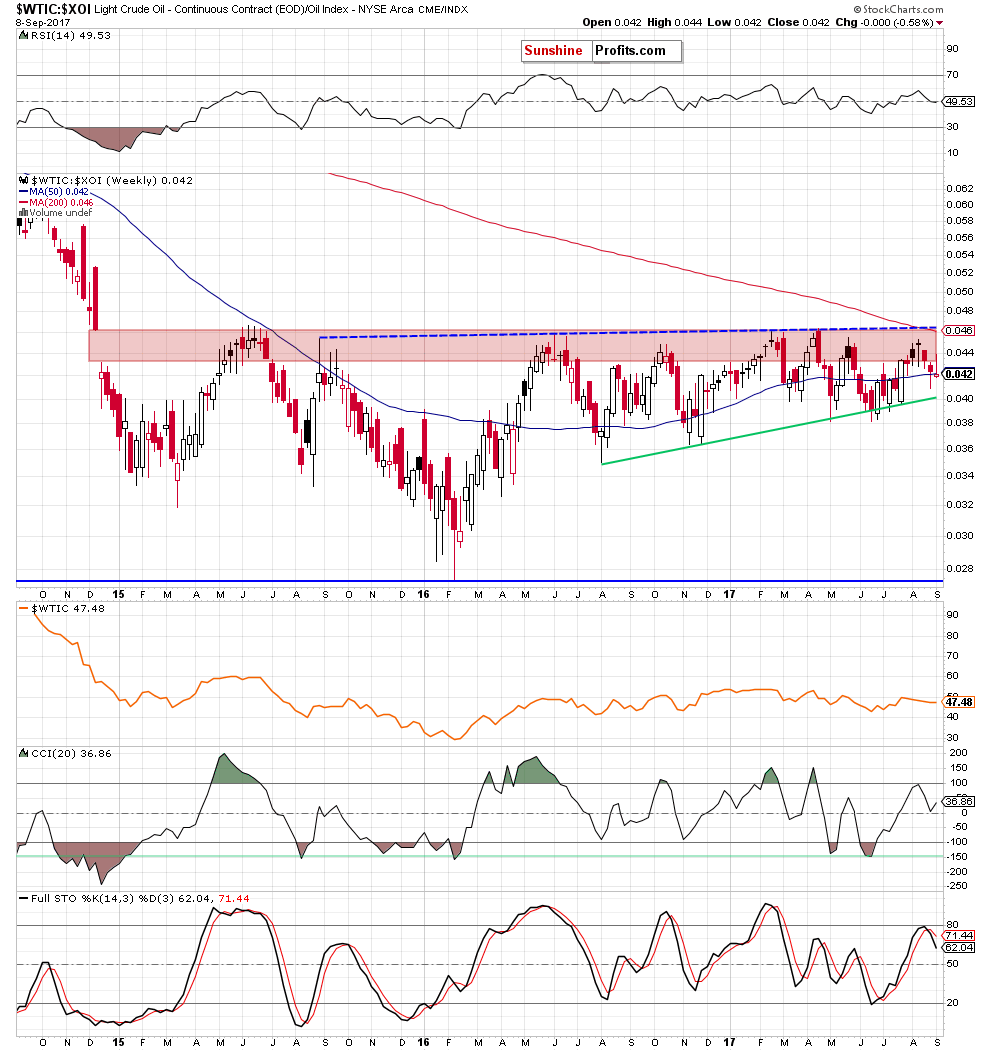
Looking at the long-term chart, we see that although oil stocks moved higher earlier this month, the XOI is still trading in the blue consolidation. Additionally, the sell signals generated by the CCI and the Stochastic Oscillator remain in place, suggesting another attempt to move lower and a test of the long-term black rising support line (currently around 1,070) in the coming month(s).
Additionally, the current situation on the short-term chart seems to confirm this scenario. Let’s take a look at the daily chart.
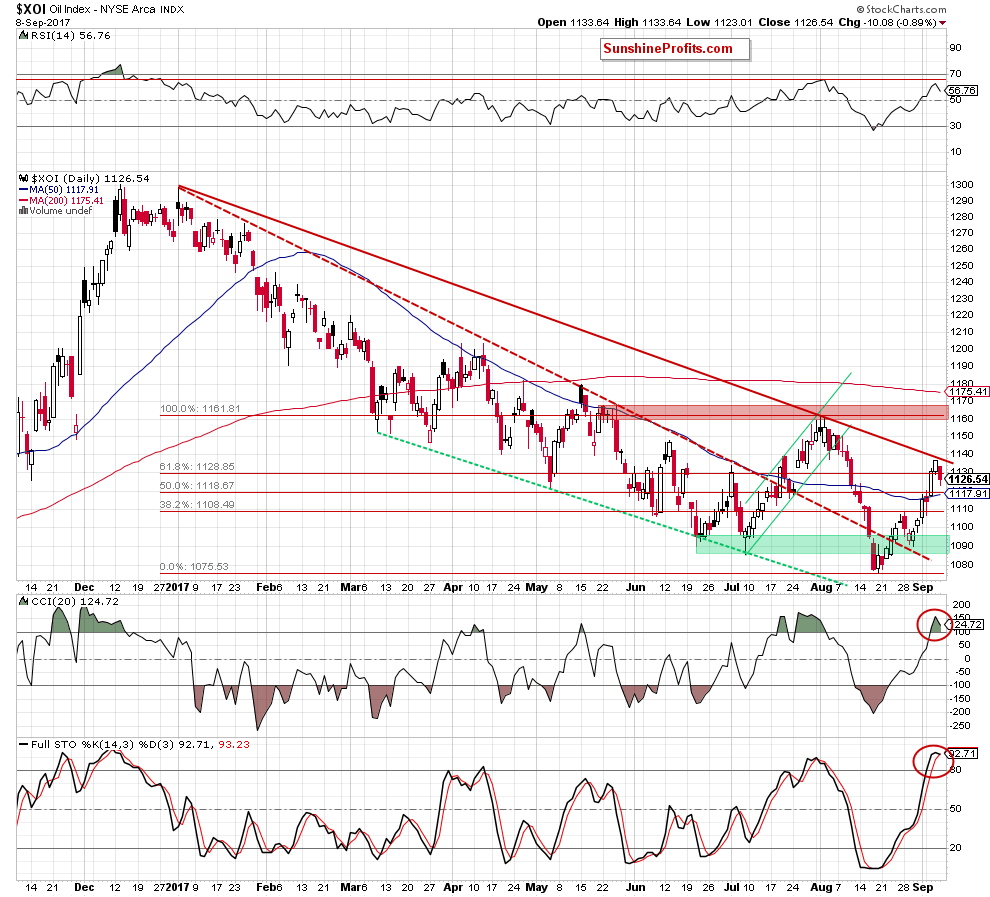
From today’s point of view, we see that although oil stocks increased slightly above the 61.8% Fibonacci retracement, the long-term red declining line stopped further improvement, triggering a pullback and invalidation of the earlier breakout above the Fibonacci retracement. Additionally, the CCI and the Stochastic Oscillator increased to the highest levels since the beginning of August, which suggests that reversal and lower values of the XOI may be just around the corner.
If this is the case and the index declines from this area, we’ll likely see a re-test of the green support zone in the coming week(s).
Scenarios
Just like a month ago, today’s Oil Investment Update includes scenarios of what could happen in the coming weeks. Naturally, we will continue to monitor the market in the coming days and if anything invalidates our long-term outlook we will send you an additional message.
- Bullish scenario
If crude oil reverses and increases in the coming week(s), the initial upside target will be around $49.36-$49.59, where the previously-broken lower border of the purple rising trend channel, the orange declining resistance line (based on the August peaks), the 200-day moving average, the purple declining resistance line based on February and Aril highs and the 50-week moving average are. If this solid resistance zone is broken and crude oil breaks above the August high of $50.43, the way to the red resistance zone marked on the daily chart (created by the May peaks and the 76.4% and 78.6% Fibonacci retracements based on the entire 2017 downward move) or even to the April highs will be open. - Bearish scenario
If the commodity drops under the Friday low, we’ll see a test of the August and July 24 lows, which together with the 61.8% retracement create the nearest support zone. If it is broken, the next downside target will be the July low of $43.65 or even the June 21 low of $42.05.
Summary
Although crude oil increased in the first week of September, the combination of the strong resistances stopped oil bulls, triggering a sharp decline on Friday. As a result, the black gold created bearish weekly candlesticks (not only on the medium-term chart of crude oil, but also in the case of oil-to-oil stocks and oil-to-gold ratios) and verified the earlier breakdowns below the medium-term purple declining resistance line based on the February and April highs, the 50-week moving average and the lower border of the purple rising trend channel. Additionally, the weekly Stochastic Oscillator and both daily indictors generated the sell signals on crude oil charts, supporting further deterioration in the coming week. On top of that, on the non-USD (WTIC:UDN ratio) chart of crude oil we can easily notice a potential head and shoulders formation (which is currently underway), which increases the probability of further declines in the coming weeks. If this is the case, we’ll see a complete or at least partial realization of our bearish scenario in the coming weeks.
This completes this month’s Oil Investment Update. Our next Oil Investment Update is scheduled for the first week of October. Oil Trading Alerts subscribers will additionally receive similar but shorter alerts on a daily basis (or more than once a day when the situation requires it). You – Oil Investment Updates subscribers – will receive short Investment Alert messages should the outlook for the medium or long term change before the next Update is posted.
Thank you.
Nadia Simmons
Forex & Oil Trading Strategist
Oil Investment Updates
Oil Trading Alerts

